Showing posts with label DMI. Show all posts

Wednesday, August 22, 2012

Has the Rally Begun for Gold, Silver and the Miners?


The 'Helicopter Economics Investing Guide' is meant to help educate people on how to make profitable investing choices in the current economic environment. We have coined this term to describe the current monetary and fiscal policies of the U.S. government, which involve unprecedented money printing. This is the official blog of the New York Investing meetup.

Gold, silver and their mining stocks have been meandering sideways for months, but it looks like the early stage of a rally has begun. Confirmation of a sustainable uptrend hasn't taken place yet and that is the point when it's a good idea to be fully invested. There is enough reason to start accumulating a position however.

The technical picture for the monetary metals and their mining ETFs on the daily charts brightened considerably on Monday and Tuesday. While this was true for a number of indicators, investors should pay closest attention to the DMI (Directional Market Indicator). This flashed a buy signal for ETF GDX, which represents the senior gold and silver mining stocks. GDXJ, the junior mining stock ETF, and the silver ETF SLV were all on the verge of doing the same on Tuesday. The ETF GLD was positively positioned for a short-term rally, but will not be able to give this signal until rallying for several more days. In any move up or down in gold and silver, it would make sense for the mining stocks to move first.
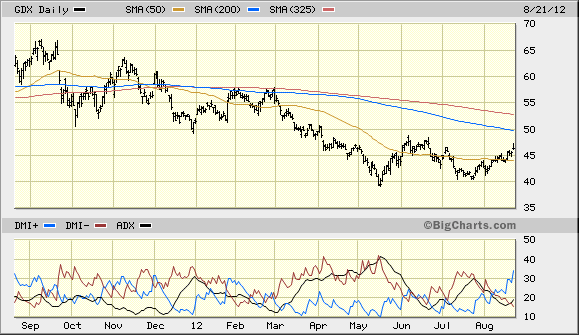


While the bullish picture isn't complete just yet on the daily charts, more work needs to be done on the weekly charts. A buy signal on these longer-term charts is the confirmation of a longer-term rally that investors would like to see. This could happen in a week or two and should be followed closely.

There is one other major missing piece for a completely bullish picture and that is the position of the moving averages. GLD, SLV, GDX and GDXJ are all in bearish patterns with the 50-day simple moving average being below the 200-day (or the 10-week is below the 40-week). The prices for all of these ETFs have moved above the 50-day and are heading for the 200-day. That resistance needs to be broken next, and then the 50-day average needs to move above the 200-day. This will take some time for the miners, but possibly very little time for GLD. Probably before this moving average cross takes place, prices will rise above the 65-week (or 325-day) moving averages. Moving and staying above this level should be interpreted as the rally is here to stay and that everything else will fall into place.

The major risk to an ongoing rally in the precious metal sector is the situation in Europe. A major drop in the euro could be bearish because this will cause the U.S. dollar to rise and gold and the dollar usually move in opposite directions. There are times however when they both move together. The risk to the global financial system caused by a euro breakdown could be one of them.

In the very long term, both gold and silver are in secular bull markets that began in 2001. This secular bull is likely to last around 20 years  and could be with us for up to 25. The biggest part of the move in secular bulls is usually in the last few years. We are still in the early stages of this rally.


Disclosure: Accumulating long positions in gold, silver and mining ETFs. 


Daryl Montgomery
Author: "Inflation Investing - A Guide for the 2010s"
Organizer, New York Investing meetup
http://investing.meetup.com/21

This posting is editorial opinion. There is no intention to endorse the purchase or sale of any security.

Friday, December 30, 2011

A Technical Look at Gold and Silver at the End of 2011


The 'Helicopter Economics Investing Guide' is meant to help educate people on how to make profitable investing choices in the current economic environment. We have coined this term to describe the current monetary and fiscal policies of the U.S. government, which involve unprecedented money printing. This is the official blog of the New York Investing meetup.

While gold and silver are in long-term secular bull markets, they have experienced price weakness in the last few months of 2011. The technical picture indicates that they are likely to remain pressured for a while longer before recovering in 2012.

GLD (the major ETF for gold)  fell below its 200-day simple moving average earlier in December and at the time, I pointed out in a previous article that this indicated lower prices in the future and it would next fall to the 325-day. After bouncing back up to the 200-day, gold did indeed fall to 148 on December 29th, which was the 325-day moving average. At the time that gold was breaking its 200-day, the DMI (directional moving indicator) also gave a sell signal on the daily charts. The RSI (relative strength index) fell below 50 and MACD (moving average convergence divergence) below the zero line -- both bearish. The sell signal on the DMI does not seem to be exhausted just yet.

The moving average picture overall still indicates that gold is in a short-term bull market. For this to turn negative, the 50-day would have to fall below the 200-day moving average and even then it shouldn't be considered as serious unless it was confirmed by a cross below the 325-day. The gives gold a lot of room to fall, even if the chart remains bullish. Even though a short rally in the beginning of 2012 is indeed possible, lower prices are likely to follow. A break of the 325-day moving average should be considered significant and would next bring GLD down to the 140 level. The 40-month simple moving average however is the most solid support below the 325-day. 


Silver shows greater weakness than gold on its charts with the selling much more advanced. Unlike gold, silver has hit new yearly lows and when this happens the first time, it is likely that a series of  new lows will then be made, although short rallies frequently take place first.  For SLV, the major silver ETF, the 50-day moving average already fell below the 200-day in October and the bearish pattern was confirmed when the 50-day then fell below the 325-day at the end of November.  On the daily charts, the DMI is on a sell signal and this seems to be only halfway done at this point. The other technical indicators are also bearish. SLV is currently being held up by support around 26. Much stronger support exists around 21 (really a band of support between 18 and 21).


The recent drops in gold and silver should be considered to be buying opportunities, although investors with a longer-term horizon should not be pushing the buy button just yet. The charts do not indicate a definitive bottom has been put in, nor that this is likely to happen in the next few weeks. Secular bull markets tend to last for around 20 years and this indicates the ultimate high for gold and silver will be around 2020. While there is always a higher high in the future during secular bulls that doesn't mean that there aren't major reversals along the way. The stock market secular bull between 1982 and 2000 had the 1987 crash, the 1989 and 1997 flash crashes, the 1990/91 bear market and the 1998 bear market. Smart investors used these declines as buying opportunities and made lots of money when they did. The same will be true for gold and silver for the rest of this decade. 

Disclosure: None

Daryl Montgomery
Author: "Inflation Investing - A Guide for the 2010s"
Organizer, New York Investing meetup
http://investing.meetup.com/21

This posting is editorial opinion. There is no intention to endorse the purchase or sale of any security.

Wednesday, October 5, 2011

Updating the Definition of a Bear Market

 
The 'Helicopter Economics Investing Guide' is meant to help educate people on how to make profitable investing choices in the current economic environment. We have coined this term to describe the current monetary and fiscal policies of the U.S. government, which involve unprecedented money printing. This is the official blog of the New York Investing meetup.

While there is a lot of talk about the S&P 500 being in a bear market because it fell 20% from its high, this definition is not particularly useful to traders or investors. The focus should be on whether or not the market is trending down and will continue to do so. A market having fallen by so much, regardless of what the amount chosen is, does not provide that information.

The term bear market dates backs to at least the 18th century and was in common use on Wall Street in the 19th. All calculations were done by hand back then and changes in prices were all traders had to go on. Just as is the case today, much of trading took place based on momentum. Traders assumed that if the market was going down, it would continue to do so and vice versa. At some point a 20% drop became the rule of thumb that a drop was serious and likely to continue. While 20% certainly indicates a  major fall in prices, the markets may or may not continue to fall after that level is reached.

A much better approach, the concept of moving averages and the idea of using them as trading guidelines didn't develop until the twentieth century. The 50-day and 200-day moving averages became the standard benchmarks for determining bullish and bearish patterns. This approach could only be widely implemented after computers became generally available. A bear pattern was established when the price fell below and remained below the 200-day moving average (the price would be trading at or below the 50-day as well). The bear would be confirmed when the 50-day moving average crossed the 200-day from above and moved below it. This is nowadays referred to with the dramatic term "death cross".  This generally takes place before a market has lost 20% of its value.

The so called death cross took place for all the major U.S. indices in August and for many this confirmed that stocks were in a bear market. The 50-day, 200-day cross is prone to failure however. It tends to give too many false signals, as was the case in the summer of 2010 when all major U.S. indices also made this cross and then reversed shortly thereafter. Not only was there no bear market, but a major rally followed.

Instead of using the 50-day and 200-day moving averages as benchmarks, a more accurate bear market
reading can be obtained from using the 50-day and 325-day moving averages (or 10-week and 65-week moving averages).  While this will provide a bear market confirmation later, it will be more accurate when it does so. It takes a lot of selling energy to drive the 50-day moving average below the 325-day and if the market can't accomplish this, a real bear market doesn't exist.  Although this provides a later sell signal, it provides an earlier buy signal on the way back up.

The S&P 500 and the Russell 2000 made the 50-day, 325-day cross in mid-September, but had already made the 10-week, 65-week cross by the beginning of the month.  The Dow industrials and the Nasdaq made the daily cross at the end of September, but had already had a cross on the weekly charts by the middle of the month. Based on the weekly charts, the S&P was already in a bear market for a month before the 20% intraday drop took place on October 4th.

Investors and traders need not rely on just moving averages to find out whether or not a bear or bull market exists. Volatility can provide an important additional clue. The daily price swings for stocks in the summer of 2010 were relatively minor compared to those in August 2011. Volatility is bearish for markets and its presence recently is just another confirmation of a serious and prolonged downturn.

Modern technical analysis also provides a whole bag of tricks to help determine if a bear or bull market exists. The DMI (directional movement indicator) is the most directly applicable. Investors want to look for a  clear sell signal with a rising trend line on the DMI  on the weekly charts (the daily charts are too "noisy"). A sell signal was given in late July on the S&P 500, the Russell 2000 and the Dow Industrials. The trend line has been going up since then indicating a strengthening downtrend. A sell signal appeared in August for Nasdaq. It then failed, but a new sell signal was given in September.

There is more than enough reason to believe that U.S. stocks are in a bear market regardless of what percentage drop has taken place. Moving averages, volatility and technical indicators are all indicating that a bear market started in the U.S. somewhere between late July and mid-September 2011. This bear will not end until the 10-week moving averages cross back above their respective 65-week moving averages, volatility calms down, and DMI buy signals are given on the weekly charts.  

Disclosure: None

Daryl Montgomery
Author: "Inflation Investing - A Guide for the 2010s"
Organizer, New York Investing meetup
http://investing.meetup.com/21

This posting is editorial opinion. There is no intention to endorse the purchase or sale of any security.

Tuesday, July 20, 2010

Why Investors Should be Cautious on Gold and Silver

The 'Helicopter Economics Investing Guide' is meant to help educate people on how to make profitable investing choices in the current economic environment. We have coined this term to describe the current monetary and fiscal policies of the U.S. government, which involve unprecedented money printing. This is the official blog of the New York Investing meetup.


While U.S. stocks peaked in late April, silver peaked in mid-May and gold in late June. While the S&P 500, Dow Industrials, and Nasdaq have all given bear market trading signals, neither gold nor silver have done so. The technical indicators for both metals are deteriorating however and more serious drops could lie ahead.

Gold and silver are unique in that they are monetary metals and the market treats them as currency subsitutes. The is more the case for gold than it is for silver. Of all the metals, gold has the least industrial use. Only about 13% of annual output is used in manufacturing, mostly for electronic products such as cell phones and computers. Gold is not useless as many commentators claim, unless you live like the Amish. Silver, on the other hand, has a greater industrial role with 50% of its production being used for this purpose. Silver will therefore be more strongly impacted by economic developments than will gold.

Both gold and silver are still trading in a bullish chart pattern with their 50-day simple moving averages above their 200-days. Their technincal indicators though have turned negative on the daily charts. Most have moved below the point that divides bullish from bearish action. The trend indicator DMI (directional movement index) gave a sell signal for gold (GLD) in early July around the same time that the more serious bear market signal took place on the S&P 500 and Dow Industrials. Yesterday, the price of silver (SLV) closed below its 200-day moving average. Gold is still trading above this key line.

In the long-term, gold and silver will prove to be two of the best investments in the market. This doesn't mean that they will go up every day or that they can't have significant reversals. A double-dip recession will certainly be a negative for silver prices, although perhaps less so than for copper or other industrial metals this time around. If silver starts to trade consistently below its 200-day moving average, it too will be giving a bear market signal. It is still too early to tell whether or not gold will follow. A price drop  to the 200-day moving average, currently at 111.61 and rising for GLD, is almost certain at this point though.

Disclosure: No Positions.

Daryl Montgomery
Organizer, New York Investing meetup
http://investing.meetup.com/21

This posting is editorial opinion. Like all other postings for this blog, there is no intention to endorse the purchase or sale of any security.

Tuesday, August 18, 2009

Monday's Ugly Market Action

The 'Helicopter Economics Investing Guide' is meant to help educate people on how to make profitable investing choices in the current economic environment. In addition to the term helicopter economics, we have also coined the term, helicopternomics, to describe the current monetary and fiscal policies of the U.S. government and to update the old-fashioned term wheelbarrow economics.

Our Video Related to this Blog:

While selling began in the U.S. on Friday, it didn't have a lot of momentum until the Asian markets opened Sunday night. Japan, Hong Kong and China were down between 3% to 5%. Last night the recovery in the East was anemic. The Nikkei was barely up and the Hang Sang was up less than 1%. The major Euro markets were all up around half a percent today. U.S. stocks are rallying as of now, but how they close is the key. The U.S. dollar is selling off and nothing significant has changed for it . It is still in a precarious state.

Basically the only thing that rallied yesterday was the U.S. dollar. Everything else sold off. This has been the common pattern since March. It doesn't make any sense based on the media story of what is going on in the markets and the economy. U.S. stocks should rally if the dollar is rallying. The opposite only occurs in inflationary environments.

The technicals on the index charts have weakened considerably in the last few weeks. The RSI on the daily charts even fell below 50 for the Nasdaq yesterday. The S&P hit 50. The Dow stayed just above it. Bouncing off this level and rallying is an almost automatic market reaction and this is happening today. We will have to see how long this lasts. The MACD is still relatively strong, so this will probably keep the market from falling apart at the moment. The DMI patterns can only be described as twisted looking. They are indicating that the uptrend is endangered.

The market seems to be in a topping pattern, but this can last awhile. As we head into the seasonal week period of September and October, the risk of a major sell off for stocks becomes greater.

NEXT: Stock Market Gappy, Inflation Worries Surface

Daryl Montgomery
Organizer,New York Investing meetup
http://investing.meetup.com/21


This posting is editorial opinion. Like all other postings for this blog, there is no intention to endorse the purchase or sale of any security.
