Showing posts with label SLV. Show all posts

Friday, September 21, 2012

The Technical Picture for Gold and Silver


The 'Helicopter Economics Investing Guide' is meant to help educate people on how to make profitable investing choices in the current economic environment. We have coined this term to describe the current monetary and fiscal policies of the U.S. government, which involve unprecedented money printing. This is the official blog of the New York Investing meetup.

The world is awash in central bank money printing, with Japan this week joining the US and the EU central banks in announcing new stimulus efforts. As long as these programs continue, investors should be bullish on gold, silver and their miners and look to accumulate on any pullback (the same can be said for other inflation-related assets as well).

While there are a number of options for buying gold, silver, and their mining stocks it is best to analyze them using the GLD for gold, SLV for silver, and GDX and GDXJ for miners. All are ETFs with GDX representing a portfolio of senior miners and GDXJ junior miners (companies doing exploration and those in pre-production). More aggressive investors can buy leveraged products such as DGL and UGLD for gold, AGQ and USLV for silver and NUGT for miners.

Technically speaking, the charts for gold, silver and the miners are strong and getting stronger. The 50-day SMA (simple moving average) of GLD crossed the 200-day SMA on Thursday. This is considered a major buy signal among technicians and ironically it's known as the golden cross.  SLV hasn't made this cross yet, but it is a mathematical certainty that it will do so. This will most likely happen by the end of next week. The miners GDX and GDXJ are somewhat behind SLV and it looks like the cross might not take place until the beginning of October. As long as the 50-day moves above the 200-day and stays above it, the bull move is confirmed.

The DMI technical indicators however already gave buy signals for GLD, SLV, GDX and GDXJ in late August. The positioning of the indicator was bullish and the trend line moved up sharply. The RSI and MACD were also properly situated to support a bullish interpretation for all the daily charts. In the last few days, the trend line has gotten too high and has moved sideways or slightly down for GLD and SLV. It is still moving up for GDX and GDXJ.

While the DMI is indicating some pullback should be coming soon, the RSI offers even more support for this view. The RSI on SLV became overbought in late August and really overbought in early September. It reached the overbought point for GLD twice in September and recently for GDX. It is high, but not overbought for GDXJ. This pattern is bullish in the intermediate term and indicates a multi-month rally is likely, but it is bearish in the short-term. Too much buying has taken place too quickly and some pressure needs to be taken off. A drop down to the 50-day SMA would be healthy at this point.

There is also a very distinctive chart pattern for GLD and SLV that should be noted by investors. So far, GLD has made a textbook perfect cup and SLV has almost as good a match (GDX and GDXJ need to build the right side of the cup more). Ordinarily, this would be followed by a handle and then a breakout from the handle and the ensuing rally should last for some time (seasonally gold tends to peak around March). A drop of say 3%-7% soon would complete the textbook pattern. 

Investors have every reason to be bullish on the monetary metals and their miners. Both the fundamental backdrop (money printing from here to eternity) and the technical picture look good. This doesn't mean that they will be going straight up without occasional drops. Just use the drops to increase your positions. Of course, like all rallies, this one too will eventually come to an end. Until then, I will be tweeting daily updates with the charts attached from my twitter account which is @nyinvesting.


Disclosure: None

Daryl Montgomery
Author: "Inflation Investing - A Guide for the 2010s"
Organizer, New York Investing meetup
http://investing.meetup.com/21

This posting is editorial opinion. There is no intention to endorse the purchase or sale of any security

Wednesday, August 22, 2012

Has the Rally Begun for Gold, Silver and the Miners?


The 'Helicopter Economics Investing Guide' is meant to help educate people on how to make profitable investing choices in the current economic environment. We have coined this term to describe the current monetary and fiscal policies of the U.S. government, which involve unprecedented money printing. This is the official blog of the New York Investing meetup.

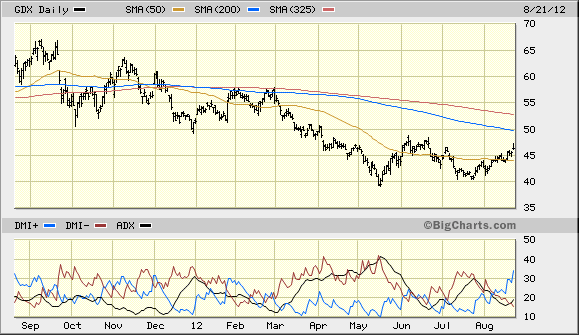
Gold, silver and their mining stocks have been meandering sideways for months, but it looks like the early stage of a rally has begun. Confirmation of a sustainable uptrend hasn't taken place yet and that is the point when it's a good idea to be fully invested. There is enough reason to start accumulating a position however.

The technical picture for the monetary metals and their mining ETFs on the daily charts brightened considerably on Monday and Tuesday. While this was true for a number of indicators, investors should pay closest attention to the DMI (Directional Market Indicator). This flashed a buy signal for ETF GDX, which represents the senior gold and silver mining stocks. GDXJ, the junior mining stock ETF, and the silver ETF SLV were all on the verge of doing the same on Tuesday. The ETF GLD was positively positioned for a short-term rally, but will not be able to give this signal until rallying for several more days. In any move up or down in gold and silver, it would make sense for the mining stocks to move first.


While the bullish picture isn't complete just yet on the daily charts, more work needs to be done on the weekly charts. A buy signal on these longer-term charts is the confirmation of a longer-term rally that investors would like to see. This could happen in a week or two and should be followed closely.

There is one other major missing piece for a completely bullish picture and that is the position of the moving averages. GLD, SLV, GDX and GDXJ are all in bearish patterns with the 50-day simple moving average being below the 200-day (or the 10-week is below the 40-week). The prices for all of these ETFs have moved above the 50-day and are heading for the 200-day. That resistance needs to be broken next, and then the 50-day average needs to move above the 200-day. This will take some time for the miners, but possibly very little time for GLD. Probably before this moving average cross takes place, prices will rise above the 65-week (or 325-day) moving averages. Moving and staying above this level should be interpreted as the rally is here to stay and that everything else will fall into place.

The major risk to an ongoing rally in the precious metal sector is the situation in Europe. A major drop in the euro could be bearish because this will cause the U.S. dollar to rise and gold and the dollar usually move in opposite directions. There are times however when they both move together. The risk to the global financial system caused by a euro breakdown could be one of them.

In the very long term, both gold and silver are in secular bull markets that began in 2001. This secular bull is likely to last around 20 years  and could be with us for up to 25. The biggest part of the move in secular bulls is usually in the last few years. We are still in the early stages of this rally.


Disclosure: Accumulating long positions in gold, silver and mining ETFs. 


Daryl Montgomery
Author: "Inflation Investing - A Guide for the 2010s"
Organizer, New York Investing meetup
http://investing.meetup.com/21

This posting is editorial opinion. There is no intention to endorse the purchase or sale of any security.

Friday, May 18, 2012

Market Selloff Might Pause Despite EU Debt Crisis


The 'Helicopter Economics Investing Guide' is meant to help educate people on how to make profitable investing choices in the current economic environment. We have coined this term to describe the current monetary and fiscal policies of the U.S. government, which involve unprecedented money printing. This is the official blog of the New York Investing meetup.

The markets should soon find support on their current selloff, but this will only be temporary.  Europe's debt problems, which are at the epicenter of the current financial crisis, are not going to go away, they are only going to get worse until some realistic solution is found.

Stocks in Europe have been selling off for days and so have the euro and gold and silver. Only on Thursday did the U.S. markets start to drop significantly. Gold (GLD) and silver (SLV) managed to rally off deeply oversold conditions after reaching chart support around their lows from late last year. Even the euro (FXE) was trying to rally after getting close to its low from January. The major U.S. market indices are all approaching their 200-day moving averages (the Russell 2000 has already reached it). Some bounce should be expected at or just above those levels. Any upward movement should be considered to be a just a relief rally for now.

Once again the debt crisis in Europe has reared its ugly head. Greece is going to have new elections in June and an anti-bailout party is expected to win. Its credit rating was downgraded to CCC by Fitch on Thursday. An exit from the euro is now being seriously discussed in the halls of European power. At the same time, interest rates are rising in Spain and Italy to the levels where the Greek problem initially began.

Spanish 10-year government yields were as high as 6.38% this morning. The same Italian interest rates had reached just above 6.00% yesterday. Italy's rates were over 7.00% from last November to early January and Spain's were close to that level in November. The ECB then began a massive effort funded with money printing to drive them back down. It worked for a while, but as soon as the printing presses are paused, the market takes right back over.

The more serious problem is with the European banking system itself. Moody's downgraded 16 Spanish banks Thursday night and Spain had to partially nationalize Bankia last week. There was a run on Bankia Thursday and massive amounts of funds have been withdrawn from the entire Greek banking system. Contagion spreading to the major banks in the rest of the EU is a real danger. The LTRO (Long-Term Refinancing Operation) programs of the ECB have encouraged them to load up on the government debt of the failing peripheral countries. Many of the banks that did so were barely solvent as is.

More bailout programs from the central banks should be expected, but they aren't likely to work either. The real problems are with the non-functional economies. Spain is still building empty houses that no one buys and the Spanish banks are funding this activity.  Adding more debt to the problem is only going to make matters worse. Printing money to pay for that debt takes the problem to an even higher level. It all has to give at some point and it looks like the new few months will be one of crisis. 

Disclosure: None

Daryl Montgomery
Author: "Inflation Investing - A Guide for the 2010s"
Organizer, New York Investing meetup
http://investing.meetup.com/21

This posting is editorial opinion. There is no intention to endorse the purchase or sale of any security.


Friday, December 30, 2011

A Technical Look at Gold and Silver at the End of 2011


The 'Helicopter Economics Investing Guide' is meant to help educate people on how to make profitable investing choices in the current economic environment. We have coined this term to describe the current monetary and fiscal policies of the U.S. government, which involve unprecedented money printing. This is the official blog of the New York Investing meetup.

While gold and silver are in long-term secular bull markets, they have experienced price weakness in the last few months of 2011. The technical picture indicates that they are likely to remain pressured for a while longer before recovering in 2012.

GLD (the major ETF for gold)  fell below its 200-day simple moving average earlier in December and at the time, I pointed out in a previous article that this indicated lower prices in the future and it would next fall to the 325-day. After bouncing back up to the 200-day, gold did indeed fall to 148 on December 29th, which was the 325-day moving average. At the time that gold was breaking its 200-day, the DMI (directional moving indicator) also gave a sell signal on the daily charts. The RSI (relative strength index) fell below 50 and MACD (moving average convergence divergence) below the zero line -- both bearish. The sell signal on the DMI does not seem to be exhausted just yet.

The moving average picture overall still indicates that gold is in a short-term bull market. For this to turn negative, the 50-day would have to fall below the 200-day moving average and even then it shouldn't be considered as serious unless it was confirmed by a cross below the 325-day. The gives gold a lot of room to fall, even if the chart remains bullish. Even though a short rally in the beginning of 2012 is indeed possible, lower prices are likely to follow. A break of the 325-day moving average should be considered significant and would next bring GLD down to the 140 level. The 40-month simple moving average however is the most solid support below the 325-day. 


Silver shows greater weakness than gold on its charts with the selling much more advanced. Unlike gold, silver has hit new yearly lows and when this happens the first time, it is likely that a series of  new lows will then be made, although short rallies frequently take place first.  For SLV, the major silver ETF, the 50-day moving average already fell below the 200-day in October and the bearish pattern was confirmed when the 50-day then fell below the 325-day at the end of November.  On the daily charts, the DMI is on a sell signal and this seems to be only halfway done at this point. The other technical indicators are also bearish. SLV is currently being held up by support around 26. Much stronger support exists around 21 (really a band of support between 18 and 21).


The recent drops in gold and silver should be considered to be buying opportunities, although investors with a longer-term horizon should not be pushing the buy button just yet. The charts do not indicate a definitive bottom has been put in, nor that this is likely to happen in the next few weeks. Secular bull markets tend to last for around 20 years and this indicates the ultimate high for gold and silver will be around 2020. While there is always a higher high in the future during secular bulls that doesn't mean that there aren't major reversals along the way. The stock market secular bull between 1982 and 2000 had the 1987 crash, the 1989 and 1997 flash crashes, the 1990/91 bear market and the 1998 bear market. Smart investors used these declines as buying opportunities and made lots of money when they did. The same will be true for gold and silver for the rest of this decade. 

Disclosure: None

Daryl Montgomery
Author: "Inflation Investing - A Guide for the 2010s"
Organizer, New York Investing meetup
http://investing.meetup.com/21

This posting is editorial opinion. There is no intention to endorse the purchase or sale of any security.

Friday, September 23, 2011

Silver Crashes; Gold Breaks Key Support


The 'Helicopter Economics Investing Guide' is meant to help educate people on how to make profitable investing choices in the current economic environment. We have coined this term to describe the current monetary and fiscal policies of the U.S. government, which involve unprecedented money printing. This is the official blog of the New York Investing meetup.

The silver market had a major crash on Friday -- there is simply no other way to put it. Spot prices were down as much as 17.1% or $6.18 an ounce. Gold was damaged as well, but not nearly as much. At its worst, it was down 6.3% or $108.60 an ounce. Both gold and silver traded below previous lows set earlier this year.

The drop in silver was truly spectacular. It was down by double digit amounts on Thursday and then by an even  greater amount today. The main silver ETF, SLV, has two huge gaps on its chart. The spot price low of $29.76 reached an area of major support. There is chart support, moving average support and a Fibonacci retracement at that level. A tradable bounce should take place soon and the gap in the chart from today is likely to be covered in that move. Those with a longer-term investing horizon might want to wait before buying. The next level to keep an eye on is around $26 where there is chart support and another Fibonacci retracement.

The silver selloff is much more advanced than is the one for gold. Silver peaked in April and had its first big selloff in May. It made a double bottom in May and July and didn't trade below those levels until today. Gold on the other hand made a double top in mid-August and early September. It confirmed that double top today by trading below its August low. Spot gold fell to $1628.60 an ounce at its worst point, breaking its support in the lower 1700s by quite a bit.

The precious metals charts are showing technical damage, with silver in much worse shape than gold. Gold broke its 50-day simple moving average yesterday for the first time since June. Today, silver pierced its 325-day simple moving average -- an important support level for any commodity. The DMI technical indicator gave a sell signal for SLV on the daily charts today and was about to do so for the major gold ETF, GLD. In the short term, both are very oversold however.

The huge price drops in silver and gold can only be explained by substantial hedge fund selling that smacks of credit crisis panic. Both of these markets have risen on highly leveraged buying. Once a few overextended funds are forced to sell because of the financial turmoil in Europe, things can go downhill pretty fast. Stops get taken out and this causes more selling, which in turn takes out more stops and leads to more selling. After this, a rally will follow and there should be a test of the low. If it holds, then a sustainable rally can take place. We are not nearly at the point yet. 

Disclosure: None

Daryl Montgomery
Author: "Inflation Investing - A Guide for the 2010s"
Organizer, New York Investing meetup
http://investing.meetup.com/21

This posting is editorial opinion. There is no intention to endorse the purchase or sale of any security.

Wednesday, September 15, 2010

Are Gold and Silver Breaking Out?

The 'Helicopter Economics Investing Guide' is meant to help educate people on how to make profitable investing choices in the current economic environment. We have coined this term to describe the current monetary and fiscal policies of the U.S. government, which involve unprecedented money printing. This is the official blog of the New York Investing meetup.


Gold hit an all-time high yesterday. Silver is trying to challenge its high from March 2008. Both are inflation indicators and new highs indicate paper money is losing its value.

Spot gold came within a whisker of $1275 an ounce yesterday and was up 2% at its high. Spot silver traded around $20.54 at its peak and has so far been a bit higher today. Unlike the U.S. stock indices, both gold and silver are in secular (long-term) and cyclical (short-term) bull markets. Their recent rise was based on reports that the Federal Reserve would likely engage in more quantitative easing. The trade-weighted dollar (ETF: DXY) dropped significantly on the news and fell below its 200-day simple moving average. The dollar has been in a secular bear market for many years and usually moves in the opposite direction of the precious metals.

The technical indicators for gold (ETF: GLD) are somewhat overbought and look like they are losing strength. Silver (ETF: SLV), is more clearly overbought than gold, but the technicals look better overall. In strong bull markets, rallies can continue on weakening technicals however. News, as is always the case, can override all other considerations - although it will have to be news about liquidity and central bank money pumping and money printing.

As I have stated many times, there is already a lot of liquidity flowing into U.S. stocks and other investment markets in the last few months. Prices for almost all assets are rising because of this. Stocks continually went up on bad economic news during the summer and while some incorrectly interpret this to mean that the market is forecasting a better economy, this is wishful thinking. Look inside a number of economic reports and you will notice that rising prices are an important reason they don't look worse. The mainstream media does not report this however because the Federal Reserve keeps telling them that 'there is no inflation'. Apparently though, the Fed forgot to inform the gold and silver markets. Perhaps they should get a memo out right away and put 'rush delivery' on it.

Disclosure: No positions.

Daryl Montgomery
Organizer, New York Investing meetup
http://investing.meetup.com/21

This posting is editorial opinion. There is no intention to endorse the purchase or sale of any security.

Tuesday, July 20, 2010

Why Investors Should be Cautious on Gold and Silver

The 'Helicopter Economics Investing Guide' is meant to help educate people on how to make profitable investing choices in the current economic environment. We have coined this term to describe the current monetary and fiscal policies of the U.S. government, which involve unprecedented money printing. This is the official blog of the New York Investing meetup.


While U.S. stocks peaked in late April, silver peaked in mid-May and gold in late June. While the S&P 500, Dow Industrials, and Nasdaq have all given bear market trading signals, neither gold nor silver have done so. The technical indicators for both metals are deteriorating however and more serious drops could lie ahead.

Gold and silver are unique in that they are monetary metals and the market treats them as currency subsitutes. The is more the case for gold than it is for silver. Of all the metals, gold has the least industrial use. Only about 13% of annual output is used in manufacturing, mostly for electronic products such as cell phones and computers. Gold is not useless as many commentators claim, unless you live like the Amish. Silver, on the other hand, has a greater industrial role with 50% of its production being used for this purpose. Silver will therefore be more strongly impacted by economic developments than will gold.

Both gold and silver are still trading in a bullish chart pattern with their 50-day simple moving averages above their 200-days. Their technincal indicators though have turned negative on the daily charts. Most have moved below the point that divides bullish from bearish action. The trend indicator DMI (directional movement index) gave a sell signal for gold (GLD) in early July around the same time that the more serious bear market signal took place on the S&P 500 and Dow Industrials. Yesterday, the price of silver (SLV) closed below its 200-day moving average. Gold is still trading above this key line.

In the long-term, gold and silver will prove to be two of the best investments in the market. This doesn't mean that they will go up every day or that they can't have significant reversals. A double-dip recession will certainly be a negative for silver prices, although perhaps less so than for copper or other industrial metals this time around. If silver starts to trade consistently below its 200-day moving average, it too will be giving a bear market signal. It is still too early to tell whether or not gold will follow. A price drop  to the 200-day moving average, currently at 111.61 and rising for GLD, is almost certain at this point though.

Disclosure: No Positions.

Daryl Montgomery
Organizer, New York Investing meetup
http://investing.meetup.com/21

This posting is editorial opinion. Like all other postings for this blog, there is no intention to endorse the purchase or sale of any security.

Tuesday, February 2, 2010

Gold Rallies Off Support; Inflation Threat Hasn't Gone Away

The 'Helicopter Economics Investing Guide' is meant to help educate people on how to make profitable investing choices in the current economic environment. We have coined this term to describe the current monetary and fiscal policies of the U.S. government, which involve unprecedented money printing. This is the official blog of the New York Investing meetup.


Gold had a strong rally the first trading day of February. This rally was significant for two reasons. First gold hit a significant support level last Friday and needed to bounce at that point if it is going to form a double bottom. Secondly, assets in bull markets should rally the first few trading days of the month. Despite a barrage of press coverage during the last several weeks, the threat of inflation hasn't diminished, nor are the world's governments likely to return to fiscal and monetary responsibility for many years into the future. Gold will continue its long-term rally until that happens.

The Credit Crisis has forced the U.S. and a number of other industrialized countries to risk either a long prolonged recessionary period or massive inflation. Modern democracies will always chose inflation because the voters will turn on any government that allows a recession to continue for a long time (unemployment rates will be what voters make their judgment on, not manipulated GDP numbers). While the Obama administration spent the last three weeks trumpeting deficit control, the 2011 proposed budget submitted by his administration on February 1st indicated deficit out-of-control instead. While there were supposedly an item here and an item there that would save $20 billion or so in the next many years, this is laughable. The budget deficit for fiscal 2010, which ends this Sept 30th, was revised downward on January 26th by $150 billion and then upward by $190 billion on February 1st. These people can't predict 10 days in advance, let alone 10 years and yet the mainstream press treated their multi-year predictions as something that should be taken seriously instead of as an item worthy of the comic pages.

Gold was also selling down because the trade-weighted U.S. dollar has been rallying since early December. The dollar rally first began because Japan and China were acting in concert to drive down the Japanese yen. In January, the euro has had the major sell off because of fears of a sovereign default by Greece. There is a real risk of this, but can the ECB let Greece default? It should be kept in mind that Greece represents only 2% of the euro zone economy. The euro has fallen by over 7% against the U.S. dollar because of the crisis. A sovereign default in Greece is likely to be much more costly than a bailout and so a bailout should be expected. It will also only be more expensive as time goes on, so an obvious question is why have the ECB leaders avoided it so far?  When this problem is resolved, both the euro and gold will rally strongly.

The press has also released items lately that are obviously meant to drive the price of gold down. The most interesting of these concerned comments made by legendary investor George Soros at the recent Davos conclave. Speaking about the excess money creation and govenment spending taking place globally, Soros said that gold would be the ultimate bubble because of these. Soros did not indicate that the bubble he foresaw was going to peak anytime soon, although the press slanted its coverage to indicate otherwise. Gold rose 25% in 2009 versus around 400% in its last year of the 1970s rally. Bubbles end in massive rallies and we have an approximate measurement of how large that rally amount is for gold because it previously ended a bubble three decades ago. When investors see gold going up several hundred percent in one year, they should worry about gold being in a bubble that is about to burst. Before then, they shouldn't. Expect to continually hear that gold is in a bubble for the next several years, especially every time it hits a new high.

In the short-term, gold is not out of the woods just yet. Investors should watch the $105.00 level on GLD. Any significant break of this would indicate that  GLD will drop to its 200-day moving average, which is around $100.00 and that spot gold would test the $1000 level. Silver would also break down from its trading range, roughly between the $16 to $19 an ounce level for spot (slightly lower for SLV). Seasonals are generally strong for both gold and silver in February, but weak in late spring. In any given short-term period, price drops are possible because of temporary liquidity restrictions from the central bank or government policy changes. Investors should particularly watch out for the increase in capital gains taxes that will take place in the U.S. on January 1, 2011. Many American long-term holders of the precious metals have big profits and if they want them taxed at a lower rate, they will have to sell before the end of 2010. Bargain hunters should take advantage of this as well as any other major sell offs in the precious metals. Gold has maintained its value for over 5000 years; paper currencies are usually lucky if they last 100 years.

Disclosure: Long gold and silver.

NEXT: Currency Markets - California Dreaming is Greek to Me

Daryl Montgomery
Organizer, New York Investing meetup
http://investing.meetup.com/21

This posting is editorial opinion. Like all other postings for this blog, there is no intention to endorse the purchase or sale of any security.

Thursday, January 7, 2010

The Fourth Trading Day of 2010 - The Message From the Market


The 'Helicopter Economics Investing Guide' is meant to help educate people on how to make profitable investing choices in the current economic environment. We have coined this term to describe the current monetary and fiscal policies of the U.S. government, which involve unprecedented money printing. This is the official blog of the New York Investing meetup.


The first four trading days of the year provide investors with an important message of where the big money is flowing in the market. More investing money gets moved around at the beginning of the year than at any other time. Overall, the picture has been very bullish. U.S. stocks, foreign stocks, emerging market stocks, large cap, mid cap and small cap stocks have all rallied. So have commodities, with inflation sensitive energy and precious metals being particularly strong. Even U.S. government bonds and the U.S. dollar have been relatively flat. How is it possible that almost nothing has gone down?  There is only one way this can happen. The liquidity available for investing purposes is increasing substantially, as has been the case since 2008. The zero or just above interest rate policies of the world's central banks are flooding the global financial system with cash. As long as this continues, global stock markets and commodities should continue to rally.

The major U.S indices were up between 1.4% and 2.7% in the four days since the close of 2009. Nasdaq did the worst and the small-cap Russell 2000 the best. A small cap versus large cap performance difference shouldn't be read into these numbers. The big cap S&P 500 was up 2.4%, doing almost as well as the Russell and the even bigger cap Dow Jones was up little more than the Nasdaq. Of the nine sectors of the market, only two were lower than their last price in 2009 - Utilities and Technology, down
-0.8% and -0.1% (essentially unchanged) respectively. The best three performing sectors were Financials, Energy and Basic Materials up 6.3%, 5.1% and 4.5%. Liquidity should have an outsized impact in these sectors and it looks like it did. Industrials put on a decent enough rally, closing up 3.5% after the first four days of trading. Government statistics indicate that manufacturing is reviving in a number of countries thanks to all the stimulus money being spent globally. Stock prices are reflecting this money pumping effort just as they are likely to reflect the withdrawal of stimulus spending when it takes place.

Stock markets outside the United States outperformed. Developed markets overall did about the same as the S&P 500, while emerging markets did somewhat better, rising 3.3%.  The BRIC markets all did well with Brazil, India and China rising between 3.1% and 3.8%. Russia led the pack though, rallying 6.4% in the beginning four days. Commodity based markets were stronger than others. Australia was up 4.1% and Canada was up 3.3%.

Commodities were up 2.5% - on par with the major U.S. stock indices, but there was a mixed picture inside the group. Silver was one of the stars, rising 7.9%. Light sweet crude oil was up 4.2% and natural gas was up 3.8%. Gold rallied 3.0%. The agricultural commodities were the laggards. The dollar was mostly unchanged during early year trading thanks to remarks by the new Japanese finance minister (an expert in health care issues and not economics by the way) who commented that he wanted the value of the yen to come down. This led to a strong rally of the U.S. dollar against the yen. Without that, the dollar would have been down in early 2010 trading. Long-term U.S. treasuries were mostly unchanged after a sharp drop in price and big gain in interest rates in December. Yields on the 10-year and 30-year were 3.82% and 4.69%  compared to 3.84% and 4.66% at the end of December.

Rallies that take place in early year trading tend to have pullbacks later in January. Investors who want to buy into the sectors that performed the best in the first four trading days should watch for these pull backs and use them as an entry point.  Some rallies are likely to go on longer than others of course. The stock market also tends to have a seasonally weak period in March and April. The current rally has already gone on for ten months and this is a long time to not have had some significant give back in price. Watch interest rates for a hint of when this might happen.

Disclosure: Long gold, silver, and natural gas and short long-term U.S. treasuries.

NEXT: U.S. Employment Figures Indicate More Stimulus Ahead

Daryl Montgomery
Organizer, New York Investing meetup
http://investing.meetup.com/21

This posting is editorial opinion. Like all other postings for this blog, there is no intention to endorse the purchase or sale of any security.

Wednesday, December 9, 2009

Is the Gold Correction Over?

The 'Helicopter Economics Investing Guide' is meant to help educate people on how to make profitable investing choices in the current economic environment. We have coined this term to describe the current monetary and fiscal policies of the U.S. government, which involve unprecedented money printing. This is the official blog of the New York Investing meetup.

Our Video Related to this Blog:

Gold has had a sharp sell-off that has took it down over $100 in four trading days from December 3rd to the 8th. The rally that began in early October took spot gold up $200 from the breakout point of $1025 to a high of $1226. Approximately 50% of that was lost by the afternoon of December 8th in New York Globex trading. The $1125 level was tested again the next evening at 2AM New York time in Hong Kong trading. A 50% drop is a key Fibonacci retracement for rallies and a common place where counter moves stop. The next Fibonacci support level would be around $1100 for spot gold if the $1125 level doesn't hold.

Other technical considerations necessitated spot gold's drop to at least the $1125 level. GLD, the largest gold ETF, had a gap on its chart just above the $110 level (it represents one-tenth of an ounce of gold and it trades at a slight discount to the spot price). That gap got filled on Tuesday. It is very common for price to trade down to the bottom of a gap, so this move was not unexpected. GLD then bounced off its 30-day simple moving average. It slightly pierced the 50 RSI level, something it also did in its last sell-off. The 50 level should be acting as support. Only a few trading days previously GLD was overbought on the RSI on the daily charts and this condition was mostly resolved on Friday, December 4th in only one day of trading. GLD was also overbought on the weekly RSI and this is also now mostly resolved, but it looks like a few weeks of back-and-fill sideways trading will still be necessary.

While sharp corrections are unnerving to investors, they are common in strong bull markets. The bigger picture is still very positive for gold and for silver. Not only is there no technical damage on the daily charts, GLD is on a buy signal on both the weekly (intermediate-term) and the monthly charts (longer-term) and so is SLV, the major silver ETF. When in doubt, investors should always consult longer term charts for guidance and remember that in bull markets, pull-backs are opportunities for buying.

When contemplating what to do in a sell-off during a rally, investors should also ask themselves if any important negative major changes are taking place. For the moment, the answer to that is no for gold. Are governments going to stop their super easy money policies or budget-busting stimulus plans? Don't hold your breath. Just yesterday both the U.S. and Japan both announced new stimulus plans. Just today, the U.S. announced that the TARP program would be extended to October 2010. The proverbial government printing presses are still in 24-7 operation and will be for some time. Gold investors will be one the prime beneficiaries of these policy moves.

Disclosure: Long gold and silver

NEXT: The Common Roots of Hyperinflation

Daryl Montgomery
Organizer,New York Investing meetup
http://investing.meetup.com/21


This posting is editorial opinion. Like all other postings for this blog, there is no intention to endorse the purchase or sale of any security.


Monday, November 23, 2009

For Gold, Overbought Means Overgood

The 'Helicopter Economics Investing Guide' is meant to help educate people on how to make profitable investing choices in the current economic environment. We have coined this term to describe the current monetary and fiscal policies of the U.S. government, which involve unprecedented money printing. This is the official blog of the New York Investing meetup.

Our Video Related to this Blog:

Gold hit another record high this morning. After closing at $1151.90 (up $6.30) at 5:15PM in New York on Friday, spot gold began rallying in Hong Kong and Sydney trading Sunday night. Shortly after trading began Monday in New York, gold reached $1171.60. Spot silver traded as high as $18.93, above its highest price last week. This is the seventh day in a row that gold has traded higher. Gold rose last Friday, even though the U.S. dollar was rallying.

COMEX December futures expire next Monday, November 30th. There is a lot of talk about the $1200 price point acting as a magnet at the expiration. It may indeed happen, but the ETF GLD has become overbought on the daily charts as of today after gapping up strongly (the price will have to trade down into the blank area of that gap at some point). GLD will hit overbought levels this week on the weekly charts as well. Some give back in price is going to be necessary soon. It may wait until after the first few trading days of December however. SLV stayed overbought on the daily charts and continued rallying for two weeks this September before there was any significant price decline.

GLD itself became overbought on the daily charts and rallied for two weeks also in September of 2007. This was at the beginning of the gold rally that lasted until March 2008. That rally had a midway pause (referred to as a high tight flag by technicians) approximately 7 weeks after GLD first became overbought on the dailies. However, the midway peak began about 1 week after gold became overbought on the weekly charts (four months before the rally ended). Since the overbought conditions are taking place coincidentally this time, we can get the midway pause for the rally starting anywhere from early December to the second week in January. Once this takes place, you can double the amount of rally from $1033 that has preceded it to get an approximation of the coming peak in spring 2010.

The silver ETF SLV has different technical patterns that does GLD. On the weekly charts, SLV isn't even remotely overbought and if silver kept on going straight up it would take approximately two more months before this could happen. A pause with some retracement and it could be another four or five months. A strong overbought condition on the weekly charts was the end of the SLV rally in March 2008. As for the daily charts SLV was overbought in February, late June and September of this year. Each overbought condition caused a temporary peak and SLV then traded higher later on. SLV still has a way to go before being overbought again on the daily charts. Look for this to happen. It will likely mark the beginning of the mid-rally pause for both silver and gold.

Disclosure: Long gold and silver

NEXT: When the Invisible Hand is the Government

Daryl Montgomery
Organizer,New York Investing meetup
http://investing.meetup.com/21

This posting is editorial opinion. Like all other postings for this blog, there is no intention to endorse the purchase or sale of any security.


Tuesday, November 17, 2009

Silver Breaks Out of Trading Range

The 'Helicopter Economics Investing Guide' is meant to help educate people on how to make profitable investing choices in the current economic environment. We have coined this term to describe the current monetary and fiscal policies of the U.S. government, which involve unprecedented money printing. This is the official blog of the New York Investing meetup.

Our Video Related to this Blog:

Precious metals had a spectacular rally on Monday. While spot gold was up 1.9% on the day and hit another all time high at $1140.80, spot silver and palladium were the stars, rising 5.6% and 5.7% respectively (platinum was up 4.2%). At more than one point silver was up over a dollar and ended trading at 5:15PM New York time up 98 cents to close at $18.42. Silver has been stuck in a trading range between $16 and $18 since September and this was the first decisive break and first close above that range. Trading volume on the EFT SLV was approximately double normal levels and was highly supportive of the move up.

Now that silver has made its move higher, the spot price needs to stay above $17.70 (the low for the day) to maintain the breakout. The reason silver was stuck at the $16 to $18 level was because of a band of resistance at those prices established in March to July 2008. There is a further resistance point around $19.00 that still needs to be taken out. After that, a test of the 2008 high just under $21 will be possible. Some more consolidation should be expected around those levels and this is likely to take place in December. Silver and gold are seasonally strong in the early part of the year though and tend to form intermediate tops in March or April, so a move to the $25 area, long-term resistance from the late 1970s, is a target price for silver next spring.

As the precious metals continue to rise, you will hear more and more talk about a bubble. Ignore it. One well-known market guru said gold was in a bubble just yesterday. While gold and silver will eventually be in a bubble, this is a long way off. They are in bull markets. The two should not be confused. The simplest way to distinguish the two is by the price patterns and extent of the rallies. Bubbles have spectacular price rises that have been preceded by long multi-year continual rallies. Silver had a price collapse from almost $21 to under $9 in 2008. It is rallying up from the bottom. This is not a bubble pattern. Gold is up 53% off of its bottom from last year. When it was in a bubble at the end of the 1970s, it went up 400% the last year. Silver was up 1000%. When you see price rises like those in a single year, that is when you need to worry about a bubble. Until then, the trend is your friend.

The other nonsense floating around the media concerning the precious metals is they are not at inflation-adjusted highs and this is somehow a negative. Is it really? The same could have been said about U.S. stocks in the 1980s. Stocks had a major rally from those levels until they reached their inflation adjusted highs in the 1990s. Then, stocks had an even bigger rally after they reached this level. When an asset isn't trading at its inflation-adjusted high, this is a reason to invest in it because it means big profits can be made. Gold and silver have been reminding us of this almost every day lately.

Disclosure: Long gold and silver.

NEXT: U.S. Inflation Reports - Contradictions and Absurdity

Daryl Montgomery
Organizer,New York Investing meetup
http://investing.meetup.com/21

This posting is editorial opinion. Like all other postings for this blog, there is no intention to endorse the purchase or sale of any security.


Wednesday, October 28, 2009

Markets Enter Danger Zone

The 'Helicopter Economics Investing Guide' is meant to help educate people on how to make profitable investing choices in the current economic environment. We have coined this term to describe the current monetary and fiscal policies of the U.S. government, which involve unprecedented money printing. This is the official blog of the New York Investing meetup.

Our Video Related to this Blog:

Almost all markets are at critical points right now. The 50-day moving averages have been broken in all the major stock indices, except for the Dow. SLV has also broken its 50-day. Gold is holding above its 50-day and hit key support at $1025 earlier. There is about a $5 gap under that level that could be filled. The RSI picture is highly negative as well. All major stock indices have broken the key 50 level, as have SLV and GLD. Long term interest rates have not only started heading up, but are trying to break a 29-year downtrend line (this would mean a many year period of rising rates). The only thing that is rallying is the U.S. trade-weighted dollar. It bounced off of the 75 level - a place where there is no technical support. The dollar rally has mostly been orchestrated by the European Central Bank, which is desperately trying to keep the euro under 1.50.

The 3rd quarter U.S. GDP figures are out this Thursday. Consensus is for a 3.2% rise. A much lower number could tank stocks. A larger number would be bullish. Regardless of what happens, the false message of economic recovery that has been repeated continually by the U.S. government will be shown up to be the fantasy that it is at some point and the pretense that the stock market rally has been based on will evaporate. It will soon become obvious though that the only way for the U.S. government to handle our ongoing economic problems will be to print more money... and more money .... and more money. At that point, stocks and the inflation trade (precious metal, energy, and agriculture) will decouple. These have been mostly moving together since March. As of now, it is not possible to say when this separation will take place.

At the moment, it is necessary to worry about everything going down. Gold and silver miners have been particularly hard hit, with small cap stocks next on the list. Some mining stocks had two and sometimes three gaps on their charts, with only one gap having been filled so far. Watch out for prices returning to levels where there is a gap. Miners are affected by the price movement of gold and by the overall stock market, so they are getting a double whammy right now. These are also highly volatile stocks prone to sharp drops and rallies. You need to buy on the dips and either hold on or sell every time there is a peak.

The struggle between the U.S. dollar and the markets is likely to continue for some time. The stock market is essentially a house of cards that can start to wobble even with a small dollar rally. A sharp drop in stocks will invariably be met by a new flood of liquidity from the Fed., which will in turn make the dollar go back down. The Fed learned that this was necessary based on last fall's market meltdown and will now repeat this action every time there is a threat to the markets. Any sharp drop will therefore likely be followed by a sharp rise. This is typical of secular bear markets. Over many years they go up and down a lot, but ultimately get nowhere. The Dow was 10,000 in 1999 and is around 10,000 right now. Gold on the other was around $250 in 1999 and is over $1000 right now. The long term trends determine where the money can be made.

NEXT: Mark to Model GDP

Daryl Montgomery
Organizer,New York Investing meetup
http://investing.meetup.com/21

This posting is editorial opinion. Like all other postings for this blog, there is no intention to endorse the purchase or sale of any security.


Friday, May 29, 2009

Silver, Oil, Gold - Market Screams Inflation is Coming

The 'Helicopter Economics Investing Guide' is meant to help educate people on how to make profitable investing choices in the current economic environment. In addition to the term helicopter economics, we have also coined the term, helicopternomics, to describe the current monetary and fiscal policies of the U.S. government and to update the old-fashioned term wheelbarrow economics.

Our Video Related to this Blog:

Silver is having its best month in 22 years. It was up to 15.49 in overnight trading, getting close to important resistance around 16.00. Gold traded as high as 974 before the U.S. markets opened, inching closer and closer to that key 1000 level. Light sweet crude was trading at 66.18 at 8:00 AM New York time. It's next resistance is in the 67 area and then 70 after that. Resource stocks were up significantly in Asian trading last night. Expect gaps up in SLV, GLD, DXO, and ERX when the U.S. market opens. Keep in mind that at some point those gaps will have to be filled.

Markets tend to be bullish at the beginning of a month, so early next week is a favorable period. While it may not happen today, silver, oil and gold will become too extended from their 10-day moving averages and will have to come back down to that line. Traders with a shorter term horizon need to take this into account. If you have a longer term perspective, you can wait until key resistance is reached. Oil is heading toward the 75-78 price level. While it may not finally peak this summer until it gets to around 100, profits should be taken in the mid-70s and oil should be swing traded shorter term at that point. You don't have to worry about gold until 1200 and silver until it reaches 21. They haven't even begun their rallies yet.

Marc Faber, a very well-known market investing advisor and market commentator that appears in Barron's annual roundtable has come out with a report stating hyperinflation in the U.S. is inevitable. While, I would certainly agree that lots of inflation here is inevitable, I don't yet think the 50% a month inflation rate needed for hyperinflation is a done deal. It is certainly a possibility though. To get to that point will take incredibly inept government policy and oblivious monetary authorities. You would practically have to have a central banker throw money out of a helicopter! By the way, the Fed is still currently worried about deflation, while printing money Zimbabwe style.

The market for all commodities is bullish going forward, but that doesn't mean there aren't going to be tradeable pull backs. Which ones you pay attention to depends on how short term your trading perspective is. Other than too much extension above the 10-day moving average, you need to be aware of the 200-day moving average - HWD (Harry Winston) is caught there at the moment, but it has a textbook perfect bullish chart - and the 38% Fibonacci retracements. If you sell with a short term perspective, you must be willing to buy back with a short term perspective as well. If you can not do this, and most people can't, wait until major resistance is hit before pulling the trigger.

NEXT: How Susan Boyle Provides a Lesson for Stock Investing

Daryl Montgomery
Organizer,New York Investing meetup
http://investing.meetup.com/21


This posting is editorial opinion. Like all other postings for this blog, there is no intention to endorse the purchase or sale of any security.


Thursday, May 28, 2009

Oil Takes Gas, Silver's Shining Moment, GM Watch

The 'Helicopter Economics Investing Guide' is meant to help educate people on how to make profitable investing choices in the current economic environment. In addition to the term helicopter economics, we have also coined the term, helicopternomics, to describe the current monetary and fiscal policies of the U.S. government and to update the old-fashioned term wheelbarrow economics.

Our Video Related to this Blog:

The oil inventory report was delayed this week and it was bullish big time for the third week in a row. The natural gas report was just better than expectations, but even this minimal accomplishment proved a combustible mix that caused UNG (the natural gas ETF) to shoot upward. SLV (the silver ETF) traded over 15.00 this morning, removing all doubt that a breakout has taken place from strong resistance around 14.50. News reports are indicating that some progress is being made with GM bondholders in a last minute effort to avert the largest industrial bankruptcy in the history of the United States.

Analysts expected that U.S. oil inventories would rise 1.8 million barrels last week. Boy did they get a surprise! Inventories fell by 5.4 million barrels. Gasoline, the major use for oil during the summer months, had 600,000 less barrels in storage. Year over year U.S. gasoline demand is down only 1.2% despite the troubled economy, yet oil is still 47% off of last year's high. Despite dropping supply and the barely lower demand for gasoline compared to the much lower price of oil, you can still find bearish comments on oil in media coverage. Our favorite oil ETF, DXO, has continually told an opposite tale however - and when in doubt, the market is always right. DXO broke above 4.00 today and should be heading higher until light sweet crude reaches at least $75 a barrel. Triple leveraged energy company ETF, ERX, is having an even better day after consolidation around support between 29 and 30 level.

While oil may have only a month or so left of its rally (frequently when the most money is made), natural gas is still putting in its bottom and I have been accumulating UNG since it fell back to the low 14's. Unlike oil, the fundamentals of natural gas are indeed negative and have been for a long time. Moreover, the favorable seasonal for natural gas can begin as late as July as opposed to February for oil. The peak is most likely in late October, early November, while oil statistically peaks in early August. This week, analysts expected U.S. storage of natural gas to increase 111 bcfs (billion cubic feet), but the increase came in at only 106 bcfs. In a heavily shorted market, that was enough to generate a big move up.

In the precious metals, SLV trading above 15.00 today was quite impressive. At the moment silver is doing better than gold, but it has a lot of catch up to do. Gold is only 4% off its recent highs of 1000, while silver is about 30% lower than it previous high around 21. SLV has another point of resistance at 16. After that, SLV testing 21 is almost certain.

Some progress seems to have been made with GM bondholders this morning. It is still too early to tell if this will come to fruition. Whether or not GM declares bankruptcy (allowing this to happen will be one of the biggest economic mistakes that the U.S. government has ever made) is obviously going to go down to the wire. The stock has not fallen below a $1.00 today however and is actually up 10% at the moment. When the market thinks a company is going bankrupt, it pushes its price into the penny level. Watch to see if this happens. While a GM bankruptcy will weigh on the market, the avoidance of bankruptcy would cause a big rally next week.

NEXT: Silver, Oil , Gold - Market Screams Inflation

Daryl Montgomery
Organizer,New York Investing meetup
http://investing.meetup.com/21

This posting is editorial opinion. Like all other postings for this blog, there is no intention to endorse the purchase or sale of any security.


Thursday, February 19, 2009

Gold and Silver Rise, Oil falls

The 'Helicopter Economics Investing Guide' is meant to help educate people on how to make profitable investing choices in the current economic environment. In addition to the term helicopter economics, we have also coined the term, helicopternomics, to describe the current monetary and fiscal policies of the U.S. government and to update the old-fashioned term wheelbarrow economics.

Our Video Related to this Blog:

Gold and silver continued their climb yesterday, while oil scraped along the bottom. The prices of all three are affected by the value of the U.S. dollar and inflation. As we covered in this blog yesterday gold demand hit a record in 2008. You can assume it will hit another record in 2009. Investment buying is the main driver, with the GLD ETF increasing its holdings 200 tons in the last month alone. Demand for oil on the other hand is falling, but not by nearly as much as the press would have you believe. The supply is likely to be falling much faster sometime in the next several months. Oil is a major bargain now, just as gold and silver were last October and November.

Gold closed at 978 in the futures market yesterday and reached 986 in London trading this morning. It should soon reach its all time high just above $1000 an ounce. Expect some selling in that area, but assume it will only be temporary. The current rise in gold is taking place because of a loss in confidence in the global financial system. This is not something that can be fixed over night, it will take many years. Gold and silver will be good investments during that period as people lose faith in paper currency and see that it is continually losing its value. Once gold breaks decisively above 1000, it should move to 1200 in a very short time. The next stop after that should be around 1500. Global governments are likely to try to dampen enthusiasm at that point by announcing an IMF gold sale or engaging in some other manipulation (a chronic problem in the gold market).

Silver always follows gold and is still far from its previous high around 21. Silver closed at 14.29 in the futures market yesterday. It's recent rally has been powerful just like gold's. Silver broke through major resistance in the mid 13's like a knife slicing through hot butter. The next stop is around 16, where the resistance is even more formidable. Expect some problems in that area. Above that there is minor resistance around 19 and then the important old high of 21. Unlike gold, silver has not made a new all time high yet. The old high from 1980 is in the 50s. It will get there eventually.

While gold and silver are operating on all cylinders, oil is languishing in the mid 30s. Light sweet crude (there are many grades of oil) may have doubled bottomed at 33+, only time will tell. Fundamentally, oil is cheap especially since it is priced in U.S. dollars, which are incredibly overvalued. The alleged oversupply of oil doesn't stand up to scrutiny either. While the supply has been building up in the U.S., the price of gasoline has been rising steadily. If there is so much oil supply why isn't it used to produce gasoline, which is obviously in short supply if the price is rising? Either there is no oversupply of oil in the U.S. or some form of manipulation is going on. You can decide for yourself.

NEXT: Oil Yes, Financials No

Daryl Montgomery
Organizer,New York Investing meetup
http://investing.meetup.com/21

This posting is editorial opinion. Like all other postings for this blog, there is no intention to endorse the purchase or sale of any security.


Friday, January 2, 2009

The Market Backdrop for 2009 - the Big Picture

The 'Helicopter Economics Investing Guide' is meant to help educate people on how to make profitable investing choices in the current economic environment. In addition to the term helicopter economics, we have also coined the term, helicopternomics, to describe the current monetary and fiscal policies of the U.S. government and to update the old-fashioned term wheelbarrow economics.

Our Video Related to this Blog:

Let's recap what took place in took place in the market in 2008. It was a year of huge price variation. Below the price ranges of the major indices and commodity ETFs:


DJIA ----------- 7392.77 low---13338.23 high
SP500 -----------741.02 low --- 1471.77 high
Nasdaq ---------1295.48 low--- 2661.50 high
Russel 2000 ------371.30 low ----768.46 high
Oil (the ETF) -----19.38 low ------88.15 high
GLD --------------66.00 low-----100.44 high
SLV----------------8.45 low------20.73 high

The end of the year is always a good time to look at the big picture for the indices as well. As we have mentioned in this blog several times, the 200 month simple moving average is a key support level that it rarely violated. The last two times this has happened was in the mid 1970s, when it occurred for around 6 months and in the first half of the 1930s, when it lasted for a few years. At the end of 2008, all the major indices violated their 200-month moving averages in the last 3 months of the year. The Dow Jones and Russell 2000 have not closed below it on a monthly basis however, while the S&P 500 and Nasdaq have had 3 closes below this line. For the market to indicate that it is becoming healthy again, the indices need to move above the 200-month moving average and stay above it as happened in the 1970s (even then it still took many years before a major bull market began again).

The monthly charts also indicate that at the very least some sideways consolidation is necessary for awhile before any longer lasting move up is likely to take place. There can be tradeable rallies in this sideways pattern, which lasted around 8 months in 2002/2003. The indices also have a tendency to double or triple bottom and this is particularly true for the S&P 500. If you look at a longer term chart, you will see a double S&P bottom so far in 2002 and 2008 (and a double top in 2000 and 2007). The S&P making a triple bottom (and even a triple top in the future) is something that should be considered.

Best of luck with your trading in 2009.

NEXT: What We Learned from the First Trading Day of 2009

Daryl Montgomery
Organizer,New York Investing meetup
http://investing.meetup.com/21

This posting is editorial opinion. Like all other postings for this blog, there is no intention to endorse the purchase or sale of any security.