Showing posts with label rally. Show all posts

Friday, September 21, 2012

The Technical Picture for Gold and Silver


The 'Helicopter Economics Investing Guide' is meant to help educate people on how to make profitable investing choices in the current economic environment. We have coined this term to describe the current monetary and fiscal policies of the U.S. government, which involve unprecedented money printing. This is the official blog of the New York Investing meetup.

The world is awash in central bank money printing, with Japan this week joining the US and the EU central banks in announcing new stimulus efforts. As long as these programs continue, investors should be bullish on gold, silver and their miners and look to accumulate on any pullback (the same can be said for other inflation-related assets as well).

While there are a number of options for buying gold, silver, and their mining stocks it is best to analyze them using the GLD for gold, SLV for silver, and GDX and GDXJ for miners. All are ETFs with GDX representing a portfolio of senior miners and GDXJ junior miners (companies doing exploration and those in pre-production). More aggressive investors can buy leveraged products such as DGL and UGLD for gold, AGQ and USLV for silver and NUGT for miners.

Technically speaking, the charts for gold, silver and the miners are strong and getting stronger. The 50-day SMA (simple moving average) of GLD crossed the 200-day SMA on Thursday. This is considered a major buy signal among technicians and ironically it's known as the golden cross.  SLV hasn't made this cross yet, but it is a mathematical certainty that it will do so. This will most likely happen by the end of next week. The miners GDX and GDXJ are somewhat behind SLV and it looks like the cross might not take place until the beginning of October. As long as the 50-day moves above the 200-day and stays above it, the bull move is confirmed.

The DMI technical indicators however already gave buy signals for GLD, SLV, GDX and GDXJ in late August. The positioning of the indicator was bullish and the trend line moved up sharply. The RSI and MACD were also properly situated to support a bullish interpretation for all the daily charts. In the last few days, the trend line has gotten too high and has moved sideways or slightly down for GLD and SLV. It is still moving up for GDX and GDXJ.

While the DMI is indicating some pullback should be coming soon, the RSI offers even more support for this view. The RSI on SLV became overbought in late August and really overbought in early September. It reached the overbought point for GLD twice in September and recently for GDX. It is high, but not overbought for GDXJ. This pattern is bullish in the intermediate term and indicates a multi-month rally is likely, but it is bearish in the short-term. Too much buying has taken place too quickly and some pressure needs to be taken off. A drop down to the 50-day SMA would be healthy at this point.

There is also a very distinctive chart pattern for GLD and SLV that should be noted by investors. So far, GLD has made a textbook perfect cup and SLV has almost as good a match (GDX and GDXJ need to build the right side of the cup more). Ordinarily, this would be followed by a handle and then a breakout from the handle and the ensuing rally should last for some time (seasonally gold tends to peak around March). A drop of say 3%-7% soon would complete the textbook pattern. 

Investors have every reason to be bullish on the monetary metals and their miners. Both the fundamental backdrop (money printing from here to eternity) and the technical picture look good. This doesn't mean that they will be going straight up without occasional drops. Just use the drops to increase your positions. Of course, like all rallies, this one too will eventually come to an end. Until then, I will be tweeting daily updates with the charts attached from my twitter account which is @nyinvesting.


Disclosure: None

Daryl Montgomery
Author: "Inflation Investing - A Guide for the 2010s"
Organizer, New York Investing meetup
http://investing.meetup.com/21

This posting is editorial opinion. There is no intention to endorse the purchase or sale of any security

Wednesday, August 22, 2012

Has the Rally Begun for Gold, Silver and the Miners?


The 'Helicopter Economics Investing Guide' is meant to help educate people on how to make profitable investing choices in the current economic environment. We have coined this term to describe the current monetary and fiscal policies of the U.S. government, which involve unprecedented money printing. This is the official blog of the New York Investing meetup.

Gold, silver and their mining stocks have been meandering sideways for months, but it looks like the early stage of a rally has begun. Confirmation of a sustainable uptrend hasn't taken place yet and that is the point when it's a good idea to be fully invested. There is enough reason to start accumulating a position however.

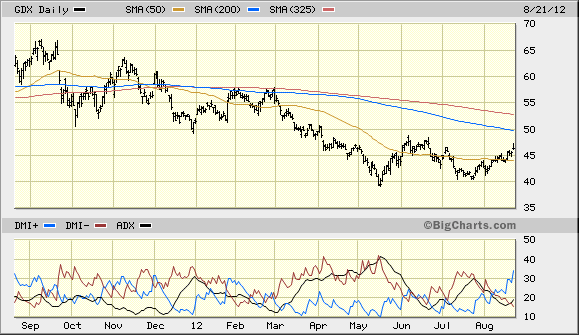
The technical picture for the monetary metals and their mining ETFs on the daily charts brightened considerably on Monday and Tuesday. While this was true for a number of indicators, investors should pay closest attention to the DMI (Directional Market Indicator). This flashed a buy signal for ETF GDX, which represents the senior gold and silver mining stocks. GDXJ, the junior mining stock ETF, and the silver ETF SLV were all on the verge of doing the same on Tuesday. The ETF GLD was positively positioned for a short-term rally, but will not be able to give this signal until rallying for several more days. In any move up or down in gold and silver, it would make sense for the mining stocks to move first.


While the bullish picture isn't complete just yet on the daily charts, more work needs to be done on the weekly charts. A buy signal on these longer-term charts is the confirmation of a longer-term rally that investors would like to see. This could happen in a week or two and should be followed closely.

There is one other major missing piece for a completely bullish picture and that is the position of the moving averages. GLD, SLV, GDX and GDXJ are all in bearish patterns with the 50-day simple moving average being below the 200-day (or the 10-week is below the 40-week). The prices for all of these ETFs have moved above the 50-day and are heading for the 200-day. That resistance needs to be broken next, and then the 50-day average needs to move above the 200-day. This will take some time for the miners, but possibly very little time for GLD. Probably before this moving average cross takes place, prices will rise above the 65-week (or 325-day) moving averages. Moving and staying above this level should be interpreted as the rally is here to stay and that everything else will fall into place.

The major risk to an ongoing rally in the precious metal sector is the situation in Europe. A major drop in the euro could be bearish because this will cause the U.S. dollar to rise and gold and the dollar usually move in opposite directions. There are times however when they both move together. The risk to the global financial system caused by a euro breakdown could be one of them.

In the very long term, both gold and silver are in secular bull markets that began in 2001. This secular bull is likely to last around 20 years  and could be with us for up to 25. The biggest part of the move in secular bulls is usually in the last few years. We are still in the early stages of this rally.


Disclosure: Accumulating long positions in gold, silver and mining ETFs. 


Daryl Montgomery
Author: "Inflation Investing - A Guide for the 2010s"
Organizer, New York Investing meetup
http://investing.meetup.com/21

This posting is editorial opinion. There is no intention to endorse the purchase or sale of any security.

Tuesday, June 1, 2010

One Way to Tell if We Are in a Bear Market

The 'Helicopter Economics Investing Guide' is meant to help educate people on how to make profitable investing choices in the current economic environment. We have coined this term to describe the current monetary and fiscal policies of the U.S. government, which involve unprecedented money printing. This is the official blog of the New York Investing meetup.


Bull markets usually go up the first four trading days of the month. After giving a strong negative signal in May, investors should be watching this indicator in the early days of June. A second negative signal would be a confirmation that a new bear market has begun.

Money tends to get reallocated at the beginning of the month. The behavior is more pronounced at the beginning of the quarter and most pronounced at the beginning of the year. In bull markets, much of this money gets allocated on the buy side for stocks. In bears markets, a higher percentage of investing money will go to safe haven assets. So in a bull market the first four trading days (not five as many sources claim) of the month tend to see a nice rise in stock prices. The first couple of days are almost always positive.

Even in strong bull markets, not every month has to have an up move in the beginning days. Every so many months, investors are likely to grow cautious and take some profits. The bulls should regain control for the next several months however before profits get high enough again so that investors want to take some money off the table. So far, the rally that began in March 2009 has managed to just hold together.

The first negative signal for the rally was given in July 2009 for the Dow Jones Industrial Average. The next month was positive though and then another negative signal was given in early September. This was followed by a number of months that when stocks were up in the first four days. Then February 2010 gave another negative signal. March and April were once again OK and then came May.  The flash crash happened on the fourth trading day of May and the market was already down before it occurred. May was an ugly month.

Four negative signals on the first four trading days of the month indicator are a lot in just over a year. It indicates a rally that has weak underpinnings (as does the falling volume on the Dow during most of the rally). We still have not as of yet seen negative signals two months in a row. Maybe we will by June 4th.  If we do, it would be strong evidence that a new bear market has begun.

Disclosure: None.

Daryl Montgomery Organizer,
New York Investing meetup
http://investing.meetup.com/21

This posting is editorial opinion. Like all other postings for this blog, there is no intention to endorse the purchase or sale of any security.

Wednesday, December 23, 2009

The Santa Claus Rally and the January Effect

The 'Helicopter Economics Investing Guide' is meant to help educate people on how to make profitable investing choices in the current economic environment. We have coined this term to describe the current monetary and fiscal policies of the U.S. government, which involve unprecedented money printing. This is the official blog of the New York Investing meetup.

The Santa Claus rally is a move up in stocks that takes place around December 25th. This rally was already part of Wall Street lore in the 1800s, and was memorialized in the ditty: 'If Santa fails to make a call, the bear will come to Broad and Wall'. There is no general agreement on the exact dates of the rally. It is defined as beginning from a few to several days before Christmas or immediately thereafter. It ends either in the current year or two or three days into the next year. It is most useful to think about it as two separate phenomenon. The first as the trading period around Christmas day and the second as the first four trading days of the new year. Each has its own message.

The bullishness in stocks around December 25th probably doesn't have much to do with the holiday per se, but with year end adjustments within the financial system. Instead of calling it the Santa Claus Rally, it would probably be more accurate to refer to it as the Year End Rally. If you look at long-term charts, you will note that the VIX, the volatility index, is either low or drops around the end of the most years. This is bullish for stocks. The VIX hit a yearly low on December 22nd in 2009 trading below 20 for the first time since the summer of 2008. An exceptionally low VIX while bullish in the short term sets the stock market up for eventual selling however.

What happens at the end of the year and at the beginning of the year can be quite different however and the two shouldn't be lumped together. Investment money tends to be reallocated at the beginning of a quarter and this is most pronounced in the first quarter. Investors should watch closely what sectors rally and what sectors of the market experience selling during the first four trading days of the year. This tells you where money is flowing. If the stock market overall sells off in the first four days, this is a bearish signal at least for the first quarter. It indicates big money is withdrawing its support from stocks.

The first four days trading signal is sometimes lumped in with the January Effect, but shouldn't be. The January Effect is a tendency for stocks to rally during the first month of the year, with small caps outperforming big and mid-caps. The January Effect was noted in the U.S. by the 1920s and perhaps even earlier. It has been observed in a number of stock markets throughout the world. The effect seems to have become dampened in recent years.

Trading volume tends to be low around the end of the year because many people are away because of the holidays. This can exaggerate price movements. Liquidity coming from the Fed and other central banks will have a more pronounced impact than usual. If you look at a chart for the U.S. Monetary Base, you will see that it has been rising vertically in the last few months. It is not surprising that the current liquidity fueled rally in stocks is continuing.

NEXT: NovaGold Leads Mining Group on Takeover

Daryl Montgomery
Organizer,New York Investing meetup
http://investing.meetup.com/21


This posting is editorial opinion. Like all other postings for this blog, there is no intention to endorse the purchase or sale of any security.


Wednesday, December 9, 2009

Is the Gold Correction Over?

The 'Helicopter Economics Investing Guide' is meant to help educate people on how to make profitable investing choices in the current economic environment. We have coined this term to describe the current monetary and fiscal policies of the U.S. government, which involve unprecedented money printing. This is the official blog of the New York Investing meetup.

Our Video Related to this Blog:

Gold has had a sharp sell-off that has took it down over $100 in four trading days from December 3rd to the 8th. The rally that began in early October took spot gold up $200 from the breakout point of $1025 to a high of $1226. Approximately 50% of that was lost by the afternoon of December 8th in New York Globex trading. The $1125 level was tested again the next evening at 2AM New York time in Hong Kong trading. A 50% drop is a key Fibonacci retracement for rallies and a common place where counter moves stop. The next Fibonacci support level would be around $1100 for spot gold if the $1125 level doesn't hold.

Other technical considerations necessitated spot gold's drop to at least the $1125 level. GLD, the largest gold ETF, had a gap on its chart just above the $110 level (it represents one-tenth of an ounce of gold and it trades at a slight discount to the spot price). That gap got filled on Tuesday. It is very common for price to trade down to the bottom of a gap, so this move was not unexpected. GLD then bounced off its 30-day simple moving average. It slightly pierced the 50 RSI level, something it also did in its last sell-off. The 50 level should be acting as support. Only a few trading days previously GLD was overbought on the RSI on the daily charts and this condition was mostly resolved on Friday, December 4th in only one day of trading. GLD was also overbought on the weekly RSI and this is also now mostly resolved, but it looks like a few weeks of back-and-fill sideways trading will still be necessary.

While sharp corrections are unnerving to investors, they are common in strong bull markets. The bigger picture is still very positive for gold and for silver. Not only is there no technical damage on the daily charts, GLD is on a buy signal on both the weekly (intermediate-term) and the monthly charts (longer-term) and so is SLV, the major silver ETF. When in doubt, investors should always consult longer term charts for guidance and remember that in bull markets, pull-backs are opportunities for buying.

When contemplating what to do in a sell-off during a rally, investors should also ask themselves if any important negative major changes are taking place. For the moment, the answer to that is no for gold. Are governments going to stop their super easy money policies or budget-busting stimulus plans? Don't hold your breath. Just yesterday both the U.S. and Japan both announced new stimulus plans. Just today, the U.S. announced that the TARP program would be extended to October 2010. The proverbial government printing presses are still in 24-7 operation and will be for some time. Gold investors will be one the prime beneficiaries of these policy moves.

Disclosure: Long gold and silver

NEXT: The Common Roots of Hyperinflation

Daryl Montgomery
Organizer,New York Investing meetup
http://investing.meetup.com/21


This posting is editorial opinion. Like all other postings for this blog, there is no intention to endorse the purchase or sale of any security.


Wednesday, September 30, 2009

Unwinding the Fantasy Trade

The 'Helicopter Economics Investing Guide' is meant to help educate people on how to make profitable investing choices in the current economic environment. In addition to the term helicopter economics, we have also coined the term, helicopternomics, to describe the current monetary and fiscal policies of the U.S. government and to update the old-fashioned term wheelbarrow economics.

Our Video Related to this Blog:

Stocks plunged after the open today on the Chicago Purchasing Managers report which indicated contraction in the largest manufacturing region of the U.S. Also this morning, commercial lender CIT, one of the largest sources of loans in the U.S. for small and midsized business, is on the verge of collapse. The company has received $5.3 billion in federal bailout money so far... and even after that, it is still having trouble staying afloat (it will be the fifth biggest bankruptcy in U.S. history if it goes under). Yesterday's September Consumer Confidence number fell instead of going up as economists predicted. Added to all this, the FDIC board voted to ask solvent banks to pre-pay the next three years of their insurance premiums so its deposit insurance fund won't run out of money. Just more evidence of how well the banking system has been 'stabilized' and how well the economic 'recovery' is doing.

The 4th quarter begins tomorrow and the first four trading days should give us a good indication about whether or not the big money will be selling stocks. A net drop in stock prices during this period will be negative going forward. The rally that has taken place since March has a typical bear market pattern to it. In the case of the Dow and S&P 500 it just shot straight up without any basing pattern forming. The rally that followed the 2000 to 2002 sell off, had a ten-month base and this is what allowed it to continue for several years. Stocks have also reached historically overbought levels based on the percentage of stocks trading above their 200-day moving average (the definition of a rally). This reached 95% on the NYSE. Previously a number in the low 70's would have been enough to create a top. While stocks have skyrocketed, Nasdaq up 68%, S&P 500 up 57% and the Dow up nearly 50%, volume has not. Volume on the Dow has continually declined during the entire rally - a very bearish pattern. Even worse a handful of junk financials, traded mostly by computer, have accounted for a large percentage of overall NYSE volume.

Stocks, and bonds as well, have had spectacular rallies because the monetary authorities have pumped an unprecedented amount of money (a lot of it newly printed) into the financial system. The U.S. government additionally changed its accounting rules and this magically made the close to worthless subprime debt held by financial companies worth a lot more overnight. The rising prices of stocks and bonds that followed have been used as evidence that the economy is recovering and along with the accounting rule changes allowed banks and brokers to report significant, but illusory, profits last quarter. The IMF has helped perpetuate this financial fantasy in a just released report that estimates that bank's losses from the Credit Crisis will only be $3.4 trillion now instead of a previously estimated $4 trillion. The logic behind their reasoning? Stock and bond prices have gone up! The IMF is still willing to admit however that U.S. banks have yet to recognize 40% of their losses and UK and euro zone banks 60% of their losses from the Credit Crisis. It warned that monetary policy makers had better consider this before deciding to withdraw the massive stimulus programs that are currently in place.

Government stimulus can only work so long in keeping stock prices up. The Japanese found this out in the 1990s and early 2000s. The Nikkei had more than one spectacular rally, but each time the rally failed because stimulus programs ended or were eventually cut back. New stimulus programs were then created and the cycle began all over again. The one thing the Japanese didn't do was fix the underlying problems with their banking system. The U.S. has not done so either and until this happens, the government can produce all the economic 'recoveries' it wants to, but they won't last. What will last is the inflation caused by all the money printing needed to produce the recoveries.

NEXT: If You Ignore the Facts, Things Are Good

Daryl Montgomery
Organizer,New York Investing meetup
http://investing.meetup.com/21

This posting is editorial opinion. Like all other postings for this blog, there is no intention to endorse the purchase or sale of any security.


Wednesday, September 2, 2009

Global Stock Markets Weaken

The 'Helicopter Economics Investing Guide' is meant to help educate people on how to make profitable investing choices in the current economic environment. In addition to the term helicopter economics, we have also coined the term, helicopternomics, to describe the current monetary and fiscal policies of the U.S. government and to update the old-fashioned term wheelbarrow economics.

Our Video Related to this Blog:

Both the Nasdaq and Dow were down 2% yesterday. The S&P 500 and Russell 2000 were down 2.3% and 2.5% respectively. Euro markets were also down yesterday after the route in the Chinese market Sunday night. While the Nikkei held up on election news, it was down 2.4% last night. Global markets have been rising together for the last 6 months and now seem to be selling off in tandem as well. China led the world's stock markets up and seems to be leading them down.

As expected, the ISM Manufacturing report yesterday came in above 50, which indicates expansion. It was the first time in 19 months above this level. The 52.9 reading was up from 48.9 in July. The new orders component was up 10% and was responsible for much of the rise. As has been pointed out in this blog, the Cash for Clunkers program is behind much of the recent burst in U.S. manufacturing activity. Recovery is only meaningful if it takes place without government stimulus however. Otherwise the economy falls right back down as happened in Japan repeatedly in the 1990s and 2000s and seems to be happening in the UK right now. The glowing bullish AP coverage of this report at least also stated "as long as consumers remain hamstrung by weak pay and job losses and wary of ramping up spending, the economy might not be able to sustain a recovery". Oh really?

Weak pay is the operative word. The Productivity Report today had productivity up 6.6% last quarter, the most in several years. While the rah-rah-rah media gave the usual bullish spin to the news, it is actually quite bleak. The big rise took place because labor costs fell so much. They were down 5.9% in Q2 after being down 5.0% in Q1. This means a lot less money is going into the average consumer's pocket. At the same time credit availability is also being cut. So how are consumers going to increase spending? Retailers are currently reporting that back to school sales are weak as should be expected. So much for 72% of the American economy doing well.

The dollar was up yesterday as has been the case since March when stocks sold off. It closed at 78.76, above its 78.33 breakdown level. It was below that key point part of the day. Gold was mostly flat yesterday, but was trading at $965 this morning. Silver is above $15. Gold is trying to get back to its $1000 breakout level and may do so soon.

NEXT: Inflation News Sends Gold Soaring

Daryl Montgomery
Organizer,New York Investing meetup
http://investing.meetup.com/21

This posting is editorial opinion. Like all other postings for this blog, there is no intention to endorse the purchase or sale of any security.


Monday, August 24, 2009

U.S. Dollar,Stocks,Bernanke and Natural Gas

The 'Helicopter Economics Investing Guide' is meant to help educate people on how to make profitable investing choices in the current economic environment. In addition to the term helicopter economics, we have also coined the term, helicopternomics, to describe the current monetary and fiscal policies of the U.S. government and to update the old-fashioned term wheelbarrow economics.

Our Video Related to this Blog:

The U.S. dollar fell below its breakdown point again on Friday. DXY, the ETF for the trade-weighted dollar, closed at 78.01 and spent much of the day trading in the 77 range. This is the second time the dollar has traded below the key breakdown point of 78.33. Last time it was below this price for 5 days. It's inability to stay above this level is a sign of weakness. Gold of course rallied and was as high as $957 during the day. It is once again trying to get back to the important $1000 breakout level.

As the dollar fell, stocks rallied. This has been a typical pattern since this March. In the larger scheme of things it is unusual however. For the first time since this phase of the rally began in July, volume was noticeably above average (average volume has been declining during the entire rally however). The rally has looked sickly so far because volume started out light and continually fell - a very negative pattern. It seems that if stocks rally, the U.S. dollar has to sell off and vice-a-versa. Something has to give soon.

What fueled the rally on Friday was existing home sales supposedly being up 7% and bullish comments by Ben Bernanke about how the recession is ending. The home sales figures are of course suspicious, but no amount of fantasy has managed to disturb the market rally so far. Bernanke, who has continually been wrong in his pronouncements on the Credit Crisis and recession is also being believed by the market for no apparent reason. Bernanke was incredibly self-congratulatory in his speech, giving the major central bankers full credit for saving the world from global recession. The proof that this has happened is minimal to say the least and exists mostly in manipulated government statistics that lack any credibility. Lost in the coverage was the failure of four more U.S. banks on Friday, including one with $13 billion in assets. So far this year 81 U.S. banks have failed, compared to 3 in 2007.

Natural gas is staying at its impossible price levels. The near-term futures contract fell as low as $2.75 toward the close on Friday. UNG was down 1.4%, while GAZ was up 1.3%. Their price movements should be almost identical and certainly they shouldn't move in opposite directions. But that is only true in reality, something which the market has become completely detached from.

NEXT: Bernanke Reappointed, Court Order and FDIC

Daryl Montgomery
Organizer,New York Investing meetup
http://investing.meetup.com/21

This posting is editorial opinion. Like all other postings for this blog, there is no intention to endorse the purchase or sale of any security.


Thursday, August 20, 2009

Oil Up; Retail, Economy and Deficit Down

The 'Helicopter Economics Investing Guide' is meant to help educate people on how to make profitable investing choices in the current economic environment. In addition to the term helicopter economics, we have also coined the term, helicopternomics, to describe the current monetary and fiscal policies of the U.S. government and to update the old-fashioned term wheelbarrow economics.

Our Video Related to this Blog:

Oil had a huge rally yesterday, going up more than 4% on a bullish storage report. It is still over $72 this morning. The oil/natural gas ratio is over 20 and is at the same high that it was in 1990 when it last peaked. There is about a 20 year cycle to this ratio and it should be falling for the next 10 years or so. We shall see. In the shorter term the natural gas storage report is out at 10:30 this morning (New York time). Natural gas can be bought either with the ETF UNG (which is being harassed by the regulatory authorities) or with the ETN GAZ. Natural gas futures are in extreme contango.

The stock market is trying to maintain its rally, which is supposedly dependent on the coming economic recovery. Sears Holdings, which released its Q2 earnings this morning, is going to be a drag on the rally today. The company lost 17 cents last quarter. Analysts expected a gain of 35 cents. Revenue fell 10.3% and was also below expectations. The company's credit rating, which was already in junk territory, was lowered further today by Moody's. Although the financial picture of this major retailer is nothing short of disastrous, the stock has risen 80% this year as of yesterday. At least it is down this morning. This company typifies the market rally - a huge rise in the midst of really bad fundamentals. Who would buy under such circumstances and why?

Weekly job claims also rose this morning to 576,000. This is still deep in recession territory. The rule of thumb for years has been weekly claims at or above 400,000 indicates the U.S. economy is in recession. A healthy economy has weekly claims around 300,000. The market had a good rally a couple of weeks ago when claims fell to 550,000. The "better numbers" were heralded in the press and claimed to be an indication of the waning recession. The press should have waited until claims fall and stay below 400,000 before publishing that story (but that would be responsible reporting, so of course that didn't happen). The press also never mentions that a large percentage of the U.S. workforce isn't eligible to collect unemployment, so when these people become unemployed they don't show up in the weekly claims figures.

The "good news" out this morning is that the Obama administration is predicting the federal budget deficit will be only $1.58 trillion this year. This is still almost 4 times bigger than the previous record budget deficit. Some contingency bailout funds for the big banks won't have to be spent (at least by September 30th of this year). Before you trust any numbers from the White House, consider that their argument for the current stimulus package was it would keep the unemployment rate at 8% or lower. Without it they claimed that unemployment could rise as high as 9%! So the stimulus package was passed early this year and so far unemployment has gotten as high as 9.5% - and that is with a lot of manipulation of the numbers to make them look better. You should assume that all the other numbers coming from the administration are just as reliable.

NEXT: Natural Gas Deconstructed

Daryl Montgomery
Organizer,New York Investing meetup
http://investing.meetup.com/21


This posting is editorial opinion. Like all other postings for this blog, there is no intention to endorse the purchase or sale of any security.


Tuesday, March 31, 2009

Next Few Trading Days Are Important

The 'Helicopter Economics Investing Guide' is meant to help educate people on how to make profitable investing choices in the current economic environment. In addition to the term helicopter economics, we have also coined the term, helicopternomics, to describe the current monetary and fiscal policies of the U.S. government and to update the old-fashioned term wheelbarrow economics.

Our Video Related to this Blog:

Money moves around at the beginning of a quarter. Look for shifts in the next few days. You want to observe whether money is flowing into the market overall or are people taking money out and selling. If the market goes up, the big money has become more confident and the rally is going to continue for awhile. It is even more important to note which sectors have money moving into them and which sectors are selling off. The three most bullish sectors of the recent rally have been financials, basic materials and technology. You would like to know if this is continuing or are other sectors getting more fund inflows.

The news backdrop may color the picture somewhat however. The G20 meeting is on Thursday and the possibility of fireworks exists. The Jobs Report is coming out Friday and the consensus is that it will be quite ugly. While this may seem like it will be negative for the market, it may not be. When people are expecting the worse, even something slightly better can be considered bullish and make stocks go up. And as we have stated many times in this blog, the U.S. government is not beyond manipulating its economic statistics to make them look better. The market, at least up to this point, takes these reports at face value no matter how absurd they might seem. The latest incarnation of this behavior has been in the seasonal adjustment figures which have recently been quite sizable and always in the direction of making things look better.

The market was filled with panic selling yesterday. I usually look at this behavior as an opportunity to buy and I did pick up some commodity stocks that had big sell offs. So far, yesterday looks like just another typical Wall Street shake down. Investors who got in at good prices are scared out of the market, those that haven't are frightened away. The big money buys the stocks the small money is selling. Take a look at the press coverage yesterday and you will see that it is overwhelmingly negative and one-sided. Many important facts are left out. This is not the coverage you typically see when the market is going to have a serious sell off. Media pundits tell you to get into the market to catch the next move up when the market is actually turning down. Wall Street is busy selling at that point - and they want you to buy.

The market is filled with bargains right now. If you concentrate on buying stocks in the commodity sector and beaten down stocks in industries that deal with the production or movement of tangible goods that are necessities or pervasive, you will make money. This is where you will get your biggest bang for the buck when inflation hits. And don't worry, expect the mainstream media to inform you in a year or two that this is what you should have been doing in early spring 2009.

NEXT: Surgery Done by a Bull in a China Shop

Daryl Montgomery
Organizer,New York Investing meetup
http://investing.meetup.com/21

This posting is editorial opinion. Like all other postings for this blog, there is no intention to endorse the purchase or sale of any security.


Tuesday, February 10, 2009

The Slippery Slope of Media Oil Coverage

The 'Helicopter Economics Investing Guide' is meant to help educate people on how to make profitable investing choices in the current economic environment. In addition to the term helicopter economics, we have also coined the term, helicopternomics, to describe the current monetary and fiscal policies of the U.S. government and to update the old-fashioned term wheelbarrow economics.

Our Video Related to this Blog:

Most investors have trouble making money in the market because they pay too much attention to the mass media. The financial press is mostly a gigantic PR outlet for Wall Street and whatever bill of goods it is trying to sell the public at the moment. Wall Streeters are of course usually doing just the opposite of the what the media is telling you to do with your investments. This is how they make their money. While Wall Street can mislead through the press, hiding its true intentions is difficult in the charts, which is why everyone should understand at least basic technical analysis.

I am looking closely at oil at the moment. If you relied on the press you wouldn't be paying any attention at all. I have read all sorts of arguments lately about why oil can't go up this year. These include such fantastic claims as a new political stability in Iraq, Iran and Nigeria (yeahh, that can happen), although they usually center around a claim that oil can't rally until the economy improves. This argument in turn relies on the basic economic principle that prices don't rise if demand is falling (certainly happening because of the crashing global economy) and supply stays the same. There is somewhat less than a zero chance that supply will stay the same however. When oil prices drop, production gets cut practically everywhere. OPEC's announced plans for another round of major cuts at its March meeting are just the tip of the iceberg. My sources in Texas tell me oil production is being shut down all over the state. I read the other day, that the tar sands in Alberta need oil to sell in the low 40's to break even. How long will production continue if oil falls and stays below that price? In fact, much of the oil that came online in the last few years is expensive oil that will no longer be produced if oil prices remain low. Given this set of circumstances, oil supply could easily fall below demand and the price of oil would then rise, not go down as all the 'pundits' claim.

The press is also giving a lot of coverage of the Stimulus Plan and whether or not it will be passed. Passage is presumed to be good for oil because the stimulus plan will revive the economy. It will certainly have some positive impact, since it is difficult for a government spending program not to (the TARP is one of those rare exceptions). The media is wasting a lot of ink on whether or not the Stimulus Plan will be passed. This is another absurdity. There is zero chance that it won't be. The vote of the typical member of the U.S. Congress is more available for sale than a crack-addicted street whore. Sure the price is more expensive and usually has to be paid in taxpayer funded giveaways, but no one in Washington cares about that.

Investors should keep in mind that by the time some change in the market is getting a lot of press coverage, it is usually well advanced. When the average person starts to be concerned, Wall Streeters have long ago taken their positions and are probably getting ready to close them out (the old 'buy on the rumor and sell on the news' saw that has been around the Street forever). Markets also don't go straight down or up forever either. Even if a long-term trend is well in place, significant reversals are likely along the way. You can make a lot of money in those reversals, but not if you pay attention to the mainstream media.

NEXT: It's Amateur Night at the U.S. Treasury

Daryl Montgomery
Organizer,New York Investing meetup
http://investing.meetup.com/21

This posting is editorial opinion. Like all other postings for this blog, there is no intention to endorse the purchase or sale of any security.


Tuesday, November 25, 2008

Geithner's appointment to Treasury - a Golden Opportunity

The 'Helicopter Economics Investing Guide' is meant to help educate people on how to make profitable investing choices in the current economic environment. In addition to the term helicopter economics, we have also coined the term, helicopternomics, to describe the current monetary and fiscal policies of the U.S. government and to update the old-fashioned term wheelbarrow economics.

Our Video Related to this Blog:

The market turnaround last Friday afternoon was reported by the financial media as resulting from the announcement that the head of the New York Fed, Timothy Geithner, would be appointed by President elect Obama as his Treasury Secretary. It would indeed be reasonable for Wall Street to cheer Geithner's appointment and the future team of takover Timothy and bailout Benny. It sent a very clear message that the new administration's policies will be to rescue any and every company needing it. While stocks rallied sharply on this news, the inflation hedges gold and silver rallied even more - and for good reason.

Geithner was the mastermind behind the AIG and Bear Stearns deals. In the case of AIG the company was nationalized by paying 10 times the market price for the U.S. taxpayer's share (if this had been a private deal he would have been sued for malfeasance). Bear Stearns was valued well below market value as a gift to JP Morgan Chase (which has a seat on the New York Fed Board of Directors by the way). Taxpayers just got to guarantee Bear's toxic loans and were left holding the bag. While most news media reported that Geithner was in favor of bailing out Lehman Brothers, this was apparently not the case. People who were on the scene at the negotiations claim otherwise. It is now widely acknowledged that allowing Lehman to fail is what has led to the market turmoil in the last two months. The PR campaign to build up Geithner obviously felt it important to rewrite history and in doing so made it clear that a universal U.S. government bailout policy was in our future.

Despite the momentary trouble that the automakers are having in Washington on getting in on the government gravy train and the failure to bail out Lehman (somewhat similar to the failure of the Fed to bail out the Bank of the United States in 1930, which had disastrous consequences), short of complete nationalization, the U.S. government couldn't do much more to support financial firms other than pump even more money into them (this will indeed be happening). Over the weekend the government guaranteed the most worthless one-sixth of Citigroup's assets. Today, the Fed announced a $600 billion program to support the mortgage market, $100 billion for Fannie Mae and Freddie Mac (two other financial black holes for government money) and $500 billion to purchase mortgage backed securities. Additionally, the Fed will lend up to $200 billion to the holders of securities backed by various types of consumer loans. So that's another $800 billion just for today. The total in the last year is way into the many trillions and you many assume most if not all of that is freshly printed money.

The implications of these moves have not gone unnoticed in the markets. Inflation sensitive silver rallied more than any stock index on both Friday and Monday. Gold, which has not been terribly damaged in the sell off during the last two months, and beaten down oil also had good rallies. The charts for gold and silver are much healthier looking than those for the major stock indices. Sustainable rallies are possible for both, while stocks look like they will need to do more work to get to that point.

NEXT: A Black (Plague) Friday for Retail

Daryl Montgomery
Organizer, New York Investing meetup
http://investing.meetup.com/21

This posting is editorial opinion. Like all other postings for this blog, there is no intention to endorse the purchase or sale of any security.


Tuesday, October 21, 2008

The Fed Should be Careful What It Wishes For

The 'Helicopter Economics Investing Guide' is meant to help educate people on how to make profitable investing choices in the current economic environment. In addition to the term helicopter economics, we have also coined the term, helicopternomics, to describe the current monetary and fiscal policies of the U.S. government and to update the old-fashioned term wheelbarrow economics.

Our Video Related to this Blog:

Volatility is still the predominant feature of the U.S. stock market, with multi-hundred point moves being a daily occurrence on the Dow. For the moment, a Monday rally pattern seems to have replaced the Monday crash pattern that began in mid-September. The media reported yesterday's big move up in stocks as the market's approval of Fed chair Bernanke's endorsement of a new economic stimulus package. This of course makes no sense. The number of stimulus packages, special Fed lending facilities, special Fed asset purchasing programs, bailouts, bailout bills and government loans since the credit crisis began is now somewhere in the double digits - there have been so many, I've lost count. The need for more is just an admission of failure for all of the other initiatives, many of which were claimed to be just what was needed to turn things around. Apparently, the turning hasn't taken place yet.

The Fed announced even another new program this morning (for $540 billion this time). It will start buying commercial paper and dollar denominated CDs directly from money market funds. If you have been following this blog, you may have thought this was already being done. However, what was taking place is the Fed has been lending banks, a $123 billion so far, the money for this type of purchase. However, $341 billion has been withdrawn from money market funds by institutional investors since that program began. So the Fed has decided to eliminate the middleman (or more appropriately the middle-bank) and put an increased amount of funding behind this operation. This new program should not be confused with the one that begins on October 27th when the Fed will begin buying up to a trillion plus of commercial paper from an array of companies. The security of U.S. money market funds was supposed to have been assured about a month ago with the (legally questionable) establishment of a $50 billion dollar government insurance fund. It looks like things aren't exactly working as planned.

Today's country to announce the latest multi-billion dollar injection into its banking system is France. The French government will provide $14 billion in funding to the nations six largest banks. This appears to be part of their half a trillion bank rescue package announced several days ago. Between these two bailout announcements, French authorities were embarrassed once again with another bank trading scandal. Caisse d'Epargne announced an $800 million loss from derivative trading that allegedly took place because of rogue traders. It makes you wonder if there are there any controls on trading operations in French banks. Regardless, the biggest banks in France, just as in other advanced economies, will be assured of survival. Smaller and medium sized banks will be the ones taking the hit from the credit crisis.

The close to infinite liquidity being poured into the world's financial system is having the immediate desired effect of lowering interbank lending rates, which fell to their lowest level in a month yesterday. While the liquidity tsunami is good in the short-term, if successful it could lead to a very ugly long-term. Examination of a U.S. Adjusted Monetary Base chart shows a line going straight up (http://research.stlouisfed.org/fred2/series/BASE). This figure is currency in circulation, plus bank reserves and a massive increase in bank reserves is what is causing its vertical rise. Since banks are not lending at the moment, the inflationary effects will be muted from these additional reserves as long as the economy remains weak. A roaring economy where banks are lending out their reserves full stop would translate to an annual U.S. inflation rate somewhere around 2000% if the current rate of increase was maintained - and that would certainly make the stock market go up.

NEXT: Stock Market Enters the Bermuda Triangle

Daryl Montgomery
Organizer, New York Investing meetup
http://investing.meetup.com/21

This posting is editorial opinion. Like all other postings for this blog, there is no intention to endorse the purchase or sale of any security.

Sunday, October 12, 2008

Do the Markets Indicate a Depression?

The 'Helicopter Economics Investing Guide' is meant to help educate people on how to make profitable investing choices in the current economic environment. In addition to the term helicopter economics, we have also coined the term, helicopternomics, to describe the current monetary and fiscal policies of the U.S. government and to update the old-fashioned term wheelbarrow economics.

Our Video Related to this Blog:

In 1931, the Dow fell below it's 200-month moving average and didn't consistently trade above it again until 1944. Following this event were the worse two years of the Great Depression in 1932 and 1933. Long term trading of the major indices below the 200-month has not reappeared in the U.S. markets since that time. Despite the huge drop in 1987, none of the indices even touched this line. In the recent 2002 market drop when the Nasdaq lost close to 80% of its value, it pierced its 200-month moving average slightly for only one month. The Dow and S&P500 were way above their 200-month averages at the 2002 bottom. Things are worse in this market sell off however and we may be entering the Depression era trading pattern once again.

This week the Dow, S&P, and Nasdaq all fell below their 200-month moving averages. The violations weren't exactly minimal either. At its low, the Dow was about 600 points below this line, the S&P more than 150 points and Nasdaq around 250 points. We will have to wait until the 31st to see if October is the first month where the indices close below this level. We will need to see a few monthly closes below the 200-month to confirm that the market is telegraphing the first economic depression in the U.S. since the 1930s. All we can say for certain now is that things are worse now than have been in many decades and we are in an ugly secular (long-term) bear market.

There are a number of other indicators indicating greater problems in the market than existed in the early 2000s and during the 1987 mega crash as well. In 2000 to 2002 sell off, intermediate market bottoms could be determined when the number of stocks on the NYSE trading below their 200-day (not month) moving averages fell to around 20%. On Friday, the figure dropped to 3%, indicating almost every U.S. stock was in a bear trading pattern. This seems to be unprecedented (once again with the possible exception of the 1930s). The TED spread, a measure of confidence in the financial system (the higher the number, the less the confidence), hit a new record high of 4.13 on Friday morning, further distancing itself from the slightly above 3.00 reading during the 1987 market route. The VIX, a measure of volatility, reached 76.94 on Friday, way above its high of 55 in 2002, but still below the total meltdown level of 150 that it got to in 1987.

It is not surprising that U.S. stocks attempted a rally on Friday. They are about as oversold as they could possibly get. Nevertheless, the Dow and S&P still couldn't close up on the day. And the Dow has now managed to close down over 100 points for seven days in a row. It dropped 18% on the week (still not as bad as many overseas markets, the FTSE in the UK was down 20% and the Nikkei in Japan was down 24%). If the market manages to continue the rally it started on Friday afternoon, some test of Friday's lows should take place within four to nine trading days - and then we may have a rally that lasts at least for several weeks. Of course, the market could still go lower sooner rather than later. Strong support levels around 7200 for the Dow, 775 for the S&P (approximately their 2002 lows) and somewhat less strong support of 1500 for Nasdaq have yet to be reached. And even after five crashes (based on intraday drops) in two weeks, another crash day still can't be ruled out.

NEXT: Unlimited Liquidity Today, Unlimited Inflation Tomorrow

Daryl Montgomery
Organizer, New York Investing meetup

This posting is editorial opinion. Like all other postings for this blog, there is no intention to endorse the purchase or sale of any security.

Thursday, September 18, 2008

The Mega Move Up in Gold and Silver

The 'Helicopter Economics Investing Guide' is meant to help educate people on how to make profitable investing choices in the current economic environment. In addition to the term helicopter economics, we have also coined the term, helicopternomics, to describe the current monetary and fiscal policies of the U.S. government and to update the old-fashioned term wheelbarrow economics.

Our video related to this posting:

It looks likes gold and silver had their biggest one day move up in history, both in absolute and percentage terms, on Wednesday . The price run up looks even bigger than the one that took place the day the previous commodities bubble peaked in 1980. The underlying picture between then and now is quite different however. While the move in 1980 indicated the end of a major rally, the move yesterday indicates the beginning of a new one.

In 1979 and into the beginning of 1980, gold and silver prices were going straight up in what is termed a blow off top. A huge move up, similar to what took place yesterday, ended the rally and the secular bull market that had been in place for the previous decade. What had preceded yesterday's rally was six months of selling for gold and silver, not buying. From high to low, gold was down 29% and silver 52%. Both had hit major areas of support - 738 for gold and 10 to 11 for silver. Gold then moved up 11.3% (or $90) and silver moved up 14.4% (or about $1.50) from the previous day. The gold miners index, the GDX was up 11.7%. These moves took place on high volume, more than triple the average for the GLD ETF and more than double for the SLV ETF, confirming the bullish picture.

The bullishness was furthermore limited to gold, silver and to a lesser extent oil (up 6.6%) and food commodities (up about 3%) . It was not part of an overall commodities rally, copper was actually down on the day, nor even a precious metals rally. Platinum was up 1.7% and palladium up only 0.5%. This rally was massive short-covering linked to increased inflation expectations and pessimism about the future of the U.S. dollar. The trade-weighted dollar fell 1.4% - a huge one-day move for a major currency. The hyper response of gold and silver to this drop indicates that much of the previous selling had been short selling and not traders dumping their positions as has been repeatedly reported in the media.

While panic buying was hitting the gold and silver market, panic selling was taking place in stocks. All of the major U.S. indices almost hit the mini-crash level of down 5%. Nasdaq came closest with a 4.9% drop on volume 50% greater than average. The Dow had a lesser drop at 4.1%, but it took place on double average volume. The S&P was down 4.7%. Since August 2007, whenever the U.S. stock market has started falling apart, the Fed has come in with some sort of major liquidity injection to prop it up. By last night one of the biggest liquidity injections ever, involving most of the world's major central banks, had been arranged. What a surprise!

NEXT: Central Bank Liquidity Tsunami Returns

Daryl Montgomery
Organizer, New York Investing meetup

This posting is editorial opinion. Like all other postings for this blog, there is no intention to endorse the purchase or sale of any security.

Thursday, July 17, 2008

Gold, Silver, Oil, and Stocks - Spring 2008

The 'Helicopter Economics Investing Guide' is meant to help educate people on how to make profitable investing choices in the current economic environment. In addition to the term helicopter economics, we have also coined the term, helicopternomics, to describe the current monetary and fiscal policies of the U.S. government and to update the old-fashioned term wheelbarrow economics.

Please see our video related to this entry: Gold, Silver and Oil - March 2008
http://www.youtube.com/watch?v=wVpcdxh1Jv8


Gold and silver both had price lows in mid-August of 2007, with gold around $640 an ounce and silver just under $11. Both started a long rally just as the U.S. Federal Reserve began it's rate lowering campaign by dropping the discount rate on August 17th. Rallies in gold and silver indicate that the Fed has set interest rates too low and its interest rate policy is inflationary. Gold and silver both did indeed rally during almost the entire period when the Fed lowered rates sending a clear message about the inflationary implications of the Fed's actions (clear to almost everyone but the Fed that is).

Since the Fed was in a race against time to prevent a recession in a presidential election year and it takes about six months for a Fed rate cut to have full impact on the economy, it was quite predictable that the Fed would be finished lowering rates by March 2008 (only one additional quarter point drop took place after that) and the gold and silver rally might end (temporarily) around that time.

Gold and silver both peaked at the time of the Fed's March meeting and began selling off immediately thereafter. Gold had psychological resistance at $1000 an ounce (a nice round number that many traders were looking for it to reach and where they planned to sell once it did). It hoovered around this level for several days and actually reached 1033 in overnight trading before the selling began. Silver, like gold, was technically overbought and even more overextended on the charts making it even more vulnerable to a sell off. Both gold and silver dropped sharply. Within only 3 days, silver lost 20% of its value.

Oil (Nymex light-sweet crude) followed a different pattern from the precious metals. It had psychological resistance at 100 and got stuck around this level in November and December of 2007. It finally broke through the 100 level in February 2008 and rallied into July until it got just over $147. While oil was rallying, gold and silver sold down in a choppy fashion until they
hit a price low in the beginning of May.

The notes for our talks on this subject can be found at: http://investing.meetup.com/21/files
1. Gold, Oil, Silver, and Stocks - March 2008
2. Gold, Silver, and Oil - April 2008

NEXT: The Inflation Versus Deflation Argument - Part I

Daryl Montgomery
Organizer, New York Investing meetup

For more about us, please see our web site: http://investing.meetup.com/21