Showing posts with label GDXJ. Show all posts

Friday, September 21, 2012

The Technical Picture for Gold and Silver


The 'Helicopter Economics Investing Guide' is meant to help educate people on how to make profitable investing choices in the current economic environment. We have coined this term to describe the current monetary and fiscal policies of the U.S. government, which involve unprecedented money printing. This is the official blog of the New York Investing meetup.

The world is awash in central bank money printing, with Japan this week joining the US and the EU central banks in announcing new stimulus efforts. As long as these programs continue, investors should be bullish on gold, silver and their miners and look to accumulate on any pullback (the same can be said for other inflation-related assets as well).

While there are a number of options for buying gold, silver, and their mining stocks it is best to analyze them using the GLD for gold, SLV for silver, and GDX and GDXJ for miners. All are ETFs with GDX representing a portfolio of senior miners and GDXJ junior miners (companies doing exploration and those in pre-production). More aggressive investors can buy leveraged products such as DGL and UGLD for gold, AGQ and USLV for silver and NUGT for miners.

Technically speaking, the charts for gold, silver and the miners are strong and getting stronger. The 50-day SMA (simple moving average) of GLD crossed the 200-day SMA on Thursday. This is considered a major buy signal among technicians and ironically it's known as the golden cross.  SLV hasn't made this cross yet, but it is a mathematical certainty that it will do so. This will most likely happen by the end of next week. The miners GDX and GDXJ are somewhat behind SLV and it looks like the cross might not take place until the beginning of October. As long as the 50-day moves above the 200-day and stays above it, the bull move is confirmed.

The DMI technical indicators however already gave buy signals for GLD, SLV, GDX and GDXJ in late August. The positioning of the indicator was bullish and the trend line moved up sharply. The RSI and MACD were also properly situated to support a bullish interpretation for all the daily charts. In the last few days, the trend line has gotten too high and has moved sideways or slightly down for GLD and SLV. It is still moving up for GDX and GDXJ.

While the DMI is indicating some pullback should be coming soon, the RSI offers even more support for this view. The RSI on SLV became overbought in late August and really overbought in early September. It reached the overbought point for GLD twice in September and recently for GDX. It is high, but not overbought for GDXJ. This pattern is bullish in the intermediate term and indicates a multi-month rally is likely, but it is bearish in the short-term. Too much buying has taken place too quickly and some pressure needs to be taken off. A drop down to the 50-day SMA would be healthy at this point.

There is also a very distinctive chart pattern for GLD and SLV that should be noted by investors. So far, GLD has made a textbook perfect cup and SLV has almost as good a match (GDX and GDXJ need to build the right side of the cup more). Ordinarily, this would be followed by a handle and then a breakout from the handle and the ensuing rally should last for some time (seasonally gold tends to peak around March). A drop of say 3%-7% soon would complete the textbook pattern. 

Investors have every reason to be bullish on the monetary metals and their miners. Both the fundamental backdrop (money printing from here to eternity) and the technical picture look good. This doesn't mean that they will be going straight up without occasional drops. Just use the drops to increase your positions. Of course, like all rallies, this one too will eventually come to an end. Until then, I will be tweeting daily updates with the charts attached from my twitter account which is @nyinvesting.


Disclosure: None

Daryl Montgomery
Author: "Inflation Investing - A Guide for the 2010s"
Organizer, New York Investing meetup
http://investing.meetup.com/21

This posting is editorial opinion. There is no intention to endorse the purchase or sale of any security

Wednesday, August 22, 2012

Has the Rally Begun for Gold, Silver and the Miners?


The 'Helicopter Economics Investing Guide' is meant to help educate people on how to make profitable investing choices in the current economic environment. We have coined this term to describe the current monetary and fiscal policies of the U.S. government, which involve unprecedented money printing. This is the official blog of the New York Investing meetup.

Gold, silver and their mining stocks have been meandering sideways for months, but it looks like the early stage of a rally has begun. Confirmation of a sustainable uptrend hasn't taken place yet and that is the point when it's a good idea to be fully invested. There is enough reason to start accumulating a position however.

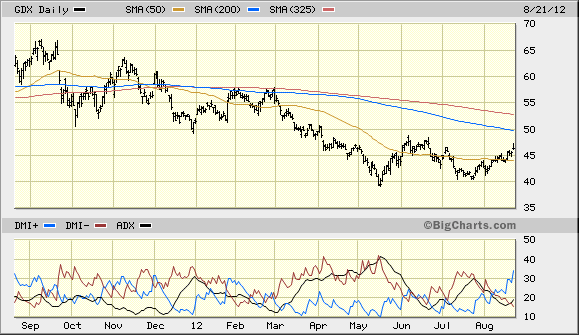
The technical picture for the monetary metals and their mining ETFs on the daily charts brightened considerably on Monday and Tuesday. While this was true for a number of indicators, investors should pay closest attention to the DMI (Directional Market Indicator). This flashed a buy signal for ETF GDX, which represents the senior gold and silver mining stocks. GDXJ, the junior mining stock ETF, and the silver ETF SLV were all on the verge of doing the same on Tuesday. The ETF GLD was positively positioned for a short-term rally, but will not be able to give this signal until rallying for several more days. In any move up or down in gold and silver, it would make sense for the mining stocks to move first.


While the bullish picture isn't complete just yet on the daily charts, more work needs to be done on the weekly charts. A buy signal on these longer-term charts is the confirmation of a longer-term rally that investors would like to see. This could happen in a week or two and should be followed closely.

There is one other major missing piece for a completely bullish picture and that is the position of the moving averages. GLD, SLV, GDX and GDXJ are all in bearish patterns with the 50-day simple moving average being below the 200-day (or the 10-week is below the 40-week). The prices for all of these ETFs have moved above the 50-day and are heading for the 200-day. That resistance needs to be broken next, and then the 50-day average needs to move above the 200-day. This will take some time for the miners, but possibly very little time for GLD. Probably before this moving average cross takes place, prices will rise above the 65-week (or 325-day) moving averages. Moving and staying above this level should be interpreted as the rally is here to stay and that everything else will fall into place.

The major risk to an ongoing rally in the precious metal sector is the situation in Europe. A major drop in the euro could be bearish because this will cause the U.S. dollar to rise and gold and the dollar usually move in opposite directions. There are times however when they both move together. The risk to the global financial system caused by a euro breakdown could be one of them.

In the very long term, both gold and silver are in secular bull markets that began in 2001. This secular bull is likely to last around 20 years  and could be with us for up to 25. The biggest part of the move in secular bulls is usually in the last few years. We are still in the early stages of this rally.


Disclosure: Accumulating long positions in gold, silver and mining ETFs. 


Daryl Montgomery
Author: "Inflation Investing - A Guide for the 2010s"
Organizer, New York Investing meetup
http://investing.meetup.com/21

This posting is editorial opinion. There is no intention to endorse the purchase or sale of any security.

Wednesday, April 4, 2012

Without Stimulus Market Can't Rally


The 'Helicopter Economics Investing Guide' is meant to help educate people on how to make profitable investing choices in the current economic environment. We have coined this term to describe the current monetary and fiscal policies of the U.S. government, which involve unprecedented money printing. This is the official blog of the New York Investing meetup.

Minutes from the last Fed's Open Market Committee meeting indicate the central bank is less likely to introduce more stimulus. While this should not have been surprising, stocks sold off on the news adding more evidence that the top has been put in.

The current market rally, indeed the entire market rally since mid-2009 has been produced primarily on liquidity provided by the Fed and other central banks. This liquidity not only allows the market to continue to rise, but it also props the market up. Without a continuing flow of liquidity, the market could easily hit an air pocket and fall apart and it can do so in a very short period of time.

The impact of what happens when just a hint that more liquidity won't be forthcoming can be seen by Wednesday's action. The Dow Jones was down 1.0% (125 points), the S&P 500 1.0% (14 points), Nasdaq 1.5% (45 points) and the small cap Russell 2000 1.7% (14 points). Commodities were hit even harder than stocks with gold dropping 3.0% or $51, silver down 4.2% or $1.33 and oil lower by $1.97 or 1.9%. Copper lost more than 3%. The major gold and silver mining ETF GDX was $ 2.05 lower or 4.2%. The junior version, the GDXJ, dropped an even dollar, also 4.2%.

While there seems to be a number of players in the market hoping for QE3, they are not likely to get their wish anytime soon. At this point it is almost impossible for the central that has been crying recovery for the past three years to justify such a move without seeming to be blatantly interfering with the ongoing presidential election. Moreover, even to an inflation-blind Fed, the risk of future rising prices is becoming increasingly difficult to ignore.

Traditionally, rallies last between six and seven months and this one is beginning its seventh month. The upside action on the indices has been decent even for an entire year. Rallies don't go to the sky however, but correct because too many people have bought and many of them have bought on margin. Once that point has been reached it takes very little to pull the market down and once the selling starts in earnest it becomes very difficult to stop. We may not be there yet, but we probably will be soon enough.


Disclosure: None

Daryl Montgomery
Author: "Inflation Investing - A Guide for the 2010s"
Organizer, New York Investing meetup
http://investing.meetup.com/21

This posting is editorial opinion. There is no intention to endorse the purchase or sale of any security.

Thursday, May 20, 2010

Gold Rally Fails: Will a Big Drop be Next?

The 'Helicopter Economics Investing Guide' is meant to help educate people on how to make profitable investing choices in the current economic environment. We have coined this term to describe the current monetary and fiscal policies of the U.S. government, which involve unprecedented money printing. This is the official blog of the New York Investing meetup.


On May 11th, gold closed at a new all-time high above $1200. I was at the Hard Assets Conference in New York that day and I was probably the only person in attendance that was not enthusiastic about the yellow metals short-term investment potential.  Now, only nine days later, it looks like the breakout has failed.

GLD, the largest Gold ETF, had reached a high around $120 in early December of last year. So far in this recent breakout it traded up to only $122.23. GLD closed at $116.63 yesterday, convincingly dropping below the high from late last year.  GLD is now likely to test its 50-day moving average, which is currently a little below $113 and rising. So far, there is no serious damage on the technical indicators, but this could take place in short order as occurred with stocks before the crash on May 6th.

When trying to determine what gold is going to do, it is a good idea to look at mining stocks. These almost always lead the metal both on the way up and the way down. Interestingly, GDX, the gold and silver ETF for the major mining companies, failed to make a new high and break out in the days around May 11th. This non-confirmation was disturbing at the time and is even more disturbing now. GDX almost touched its 50-day moving average in the almost $30 drop in gold prices yesterday. The more volatile GDXJ, the junior miners ETF, convincingly sliced through its 50-day and closed well below it. The technical indicators on GDXJ are starting to look quite sickly. The juniors are clearly breaking down and it makes sense that they should lead the way for the complex. If so, bullion itself could be in a lot of trouble soon.

Investors should remember that gold sold off substantially in the fall of 2008, although not nearly as much as most stocks or other metals. Junior mining stocks were as devastated as the financials and had some of the biggest drops of all. If we are entering into another global financial crisis, gold may once again fail to live up to its safe haven reputation. This situation can arise once again because the central banks cheaply lease their gold to the big banks and hedge funds. When the trading houses are desperate for cash because they are having difficulty selling their assets, they can lease gold and sell in on the open market immediately. This sudden supply being dumped on the market overwhelms safe haven buying and suppresses gold prices. If we have begun global Credit Crisis #2 because of the problems with the euro, investors will once again have access to bargain priced gold.  It's at that point that investors should stock up.

Disclosure: No positions.

Daryl Montgomery
Organizer, New York Investing meetup
http://investing.meetup.com/21

This posting is editorial opinion. Like all other postings for this blog, there is no intention to endorse the purchase or sale of any security.