Showing posts with label gold. Show all posts

Friday, September 21, 2012

The Technical Picture for Gold and Silver


The 'Helicopter Economics Investing Guide' is meant to help educate people on how to make profitable investing choices in the current economic environment. We have coined this term to describe the current monetary and fiscal policies of the U.S. government, which involve unprecedented money printing. This is the official blog of the New York Investing meetup.

The world is awash in central bank money printing, with Japan this week joining the US and the EU central banks in announcing new stimulus efforts. As long as these programs continue, investors should be bullish on gold, silver and their miners and look to accumulate on any pullback (the same can be said for other inflation-related assets as well).

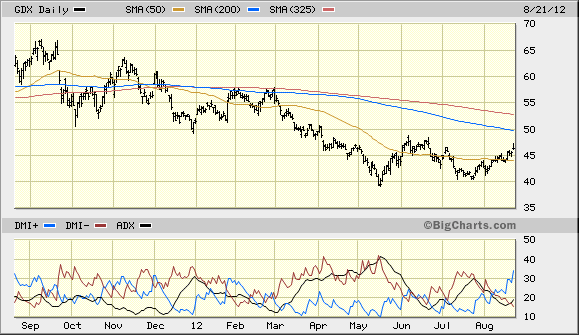
While there are a number of options for buying gold, silver, and their mining stocks it is best to analyze them using the GLD for gold, SLV for silver, and GDX and GDXJ for miners. All are ETFs with GDX representing a portfolio of senior miners and GDXJ junior miners (companies doing exploration and those in pre-production). More aggressive investors can buy leveraged products such as DGL and UGLD for gold, AGQ and USLV for silver and NUGT for miners.

Technically speaking, the charts for gold, silver and the miners are strong and getting stronger. The 50-day SMA (simple moving average) of GLD crossed the 200-day SMA on Thursday. This is considered a major buy signal among technicians and ironically it's known as the golden cross.  SLV hasn't made this cross yet, but it is a mathematical certainty that it will do so. This will most likely happen by the end of next week. The miners GDX and GDXJ are somewhat behind SLV and it looks like the cross might not take place until the beginning of October. As long as the 50-day moves above the 200-day and stays above it, the bull move is confirmed.

The DMI technical indicators however already gave buy signals for GLD, SLV, GDX and GDXJ in late August. The positioning of the indicator was bullish and the trend line moved up sharply. The RSI and MACD were also properly situated to support a bullish interpretation for all the daily charts. In the last few days, the trend line has gotten too high and has moved sideways or slightly down for GLD and SLV. It is still moving up for GDX and GDXJ.

While the DMI is indicating some pullback should be coming soon, the RSI offers even more support for this view. The RSI on SLV became overbought in late August and really overbought in early September. It reached the overbought point for GLD twice in September and recently for GDX. It is high, but not overbought for GDXJ. This pattern is bullish in the intermediate term and indicates a multi-month rally is likely, but it is bearish in the short-term. Too much buying has taken place too quickly and some pressure needs to be taken off. A drop down to the 50-day SMA would be healthy at this point.

There is also a very distinctive chart pattern for GLD and SLV that should be noted by investors. So far, GLD has made a textbook perfect cup and SLV has almost as good a match (GDX and GDXJ need to build the right side of the cup more). Ordinarily, this would be followed by a handle and then a breakout from the handle and the ensuing rally should last for some time (seasonally gold tends to peak around March). A drop of say 3%-7% soon would complete the textbook pattern. 

Investors have every reason to be bullish on the monetary metals and their miners. Both the fundamental backdrop (money printing from here to eternity) and the technical picture look good. This doesn't mean that they will be going straight up without occasional drops. Just use the drops to increase your positions. Of course, like all rallies, this one too will eventually come to an end. Until then, I will be tweeting daily updates with the charts attached from my twitter account which is @nyinvesting.


Disclosure: None

Daryl Montgomery
Author: "Inflation Investing - A Guide for the 2010s"
Organizer, New York Investing meetup
http://investing.meetup.com/21

This posting is editorial opinion. There is no intention to endorse the purchase or sale of any security

Wednesday, August 22, 2012

Has the Rally Begun for Gold, Silver and the Miners?


The 'Helicopter Economics Investing Guide' is meant to help educate people on how to make profitable investing choices in the current economic environment. We have coined this term to describe the current monetary and fiscal policies of the U.S. government, which involve unprecedented money printing. This is the official blog of the New York Investing meetup.

Gold, silver and their mining stocks have been meandering sideways for months, but it looks like the early stage of a rally has begun. Confirmation of a sustainable uptrend hasn't taken place yet and that is the point when it's a good idea to be fully invested. There is enough reason to start accumulating a position however.

The technical picture for the monetary metals and their mining ETFs on the daily charts brightened considerably on Monday and Tuesday. While this was true for a number of indicators, investors should pay closest attention to the DMI (Directional Market Indicator). This flashed a buy signal for ETF GDX, which represents the senior gold and silver mining stocks. GDXJ, the junior mining stock ETF, and the silver ETF SLV were all on the verge of doing the same on Tuesday. The ETF GLD was positively positioned for a short-term rally, but will not be able to give this signal until rallying for several more days. In any move up or down in gold and silver, it would make sense for the mining stocks to move first.


While the bullish picture isn't complete just yet on the daily charts, more work needs to be done on the weekly charts. A buy signal on these longer-term charts is the confirmation of a longer-term rally that investors would like to see. This could happen in a week or two and should be followed closely.

There is one other major missing piece for a completely bullish picture and that is the position of the moving averages. GLD, SLV, GDX and GDXJ are all in bearish patterns with the 50-day simple moving average being below the 200-day (or the 10-week is below the 40-week). The prices for all of these ETFs have moved above the 50-day and are heading for the 200-day. That resistance needs to be broken next, and then the 50-day average needs to move above the 200-day. This will take some time for the miners, but possibly very little time for GLD. Probably before this moving average cross takes place, prices will rise above the 65-week (or 325-day) moving averages. Moving and staying above this level should be interpreted as the rally is here to stay and that everything else will fall into place.

The major risk to an ongoing rally in the precious metal sector is the situation in Europe. A major drop in the euro could be bearish because this will cause the U.S. dollar to rise and gold and the dollar usually move in opposite directions. There are times however when they both move together. The risk to the global financial system caused by a euro breakdown could be one of them.

In the very long term, both gold and silver are in secular bull markets that began in 2001. This secular bull is likely to last around 20 years  and could be with us for up to 25. The biggest part of the move in secular bulls is usually in the last few years. We are still in the early stages of this rally.


Disclosure: Accumulating long positions in gold, silver and mining ETFs. 


Daryl Montgomery
Author: "Inflation Investing - A Guide for the 2010s"
Organizer, New York Investing meetup
http://investing.meetup.com/21

This posting is editorial opinion. There is no intention to endorse the purchase or sale of any security.

Wednesday, April 4, 2012

Without Stimulus Market Can't Rally


The 'Helicopter Economics Investing Guide' is meant to help educate people on how to make profitable investing choices in the current economic environment. We have coined this term to describe the current monetary and fiscal policies of the U.S. government, which involve unprecedented money printing. This is the official blog of the New York Investing meetup.

Minutes from the last Fed's Open Market Committee meeting indicate the central bank is less likely to introduce more stimulus. While this should not have been surprising, stocks sold off on the news adding more evidence that the top has been put in.

The current market rally, indeed the entire market rally since mid-2009 has been produced primarily on liquidity provided by the Fed and other central banks. This liquidity not only allows the market to continue to rise, but it also props the market up. Without a continuing flow of liquidity, the market could easily hit an air pocket and fall apart and it can do so in a very short period of time.

The impact of what happens when just a hint that more liquidity won't be forthcoming can be seen by Wednesday's action. The Dow Jones was down 1.0% (125 points), the S&P 500 1.0% (14 points), Nasdaq 1.5% (45 points) and the small cap Russell 2000 1.7% (14 points). Commodities were hit even harder than stocks with gold dropping 3.0% or $51, silver down 4.2% or $1.33 and oil lower by $1.97 or 1.9%. Copper lost more than 3%. The major gold and silver mining ETF GDX was $ 2.05 lower or 4.2%. The junior version, the GDXJ, dropped an even dollar, also 4.2%.

While there seems to be a number of players in the market hoping for QE3, they are not likely to get their wish anytime soon. At this point it is almost impossible for the central that has been crying recovery for the past three years to justify such a move without seeming to be blatantly interfering with the ongoing presidential election. Moreover, even to an inflation-blind Fed, the risk of future rising prices is becoming increasingly difficult to ignore.

Traditionally, rallies last between six and seven months and this one is beginning its seventh month. The upside action on the indices has been decent even for an entire year. Rallies don't go to the sky however, but correct because too many people have bought and many of them have bought on margin. Once that point has been reached it takes very little to pull the market down and once the selling starts in earnest it becomes very difficult to stop. We may not be there yet, but we probably will be soon enough.


Disclosure: None

Daryl Montgomery
Author: "Inflation Investing - A Guide for the 2010s"
Organizer, New York Investing meetup
http://investing.meetup.com/21

This posting is editorial opinion. There is no intention to endorse the purchase or sale of any security.

Friday, December 30, 2011

A Technical Look at Gold and Silver at the End of 2011


The 'Helicopter Economics Investing Guide' is meant to help educate people on how to make profitable investing choices in the current economic environment. We have coined this term to describe the current monetary and fiscal policies of the U.S. government, which involve unprecedented money printing. This is the official blog of the New York Investing meetup.

While gold and silver are in long-term secular bull markets, they have experienced price weakness in the last few months of 2011. The technical picture indicates that they are likely to remain pressured for a while longer before recovering in 2012.

GLD (the major ETF for gold)  fell below its 200-day simple moving average earlier in December and at the time, I pointed out in a previous article that this indicated lower prices in the future and it would next fall to the 325-day. After bouncing back up to the 200-day, gold did indeed fall to 148 on December 29th, which was the 325-day moving average. At the time that gold was breaking its 200-day, the DMI (directional moving indicator) also gave a sell signal on the daily charts. The RSI (relative strength index) fell below 50 and MACD (moving average convergence divergence) below the zero line -- both bearish. The sell signal on the DMI does not seem to be exhausted just yet.

The moving average picture overall still indicates that gold is in a short-term bull market. For this to turn negative, the 50-day would have to fall below the 200-day moving average and even then it shouldn't be considered as serious unless it was confirmed by a cross below the 325-day. The gives gold a lot of room to fall, even if the chart remains bullish. Even though a short rally in the beginning of 2012 is indeed possible, lower prices are likely to follow. A break of the 325-day moving average should be considered significant and would next bring GLD down to the 140 level. The 40-month simple moving average however is the most solid support below the 325-day. 


Silver shows greater weakness than gold on its charts with the selling much more advanced. Unlike gold, silver has hit new yearly lows and when this happens the first time, it is likely that a series of  new lows will then be made, although short rallies frequently take place first.  For SLV, the major silver ETF, the 50-day moving average already fell below the 200-day in October and the bearish pattern was confirmed when the 50-day then fell below the 325-day at the end of November.  On the daily charts, the DMI is on a sell signal and this seems to be only halfway done at this point. The other technical indicators are also bearish. SLV is currently being held up by support around 26. Much stronger support exists around 21 (really a band of support between 18 and 21).


The recent drops in gold and silver should be considered to be buying opportunities, although investors with a longer-term horizon should not be pushing the buy button just yet. The charts do not indicate a definitive bottom has been put in, nor that this is likely to happen in the next few weeks. Secular bull markets tend to last for around 20 years and this indicates the ultimate high for gold and silver will be around 2020. While there is always a higher high in the future during secular bulls that doesn't mean that there aren't major reversals along the way. The stock market secular bull between 1982 and 2000 had the 1987 crash, the 1989 and 1997 flash crashes, the 1990/91 bear market and the 1998 bear market. Smart investors used these declines as buying opportunities and made lots of money when they did. The same will be true for gold and silver for the rest of this decade. 

Disclosure: None

Daryl Montgomery
Author: "Inflation Investing - A Guide for the 2010s"
Organizer, New York Investing meetup
http://investing.meetup.com/21

This posting is editorial opinion. There is no intention to endorse the purchase or sale of any security.

Thursday, December 15, 2011

Gold Breaks Down, Where to Look for a Bottom


The 'Helicopter Economics Investing Guide' is meant to help educate people on how to make profitable investing choices in the current economic environment. We have coined this term to describe the current monetary and fiscal policies of the U.S. government, which involve unprecedented money printing. This is the official blog of the New York Investing meetup.

Gold fell and closed below its 200-day moving average yesterday, December 14th. This indicates a technical breakdown and the last time this happened was in August 2008. Gold bottomed approximately 30% off its high three months later in November.

Any analysis of an investment's technical state should begin with the big picture, so recent events can be put in context. Gold is in a secular (long-term) bull market which will last until approximately 2020. This means that the greater trend will move prices higher over time. No market moves straight up however. There are always reversals in a secular bull market and these are sometimes steep. The 1987 stock market crash which took the U.S. indices down 40% and some individual stocks down 70% or even 80% took place in a secular bull market that lasted between 1982 and 2000. Stock prices went to new highs after the crash despite many pundits claiming the crash meant a new depression was coming. Anyone who realized stocks were in a secular bull market could easily have predicted stocks would recover.

Even though gold has dropped below its 200-day (40-week) simple moving average, this does not indicate that it is even in a short-term bear market. At the very least the 50-day (10-week) moving average would have to fall below the 200-day to indicate that. Gold will have to trade below it's 200-day for approximately the next two weeks before that would happen. This did indeed occur in 2008, when it could be said that gold experienced a brief cyclical (short-term) bear market.  The 10-week moving average traded below the 40-week for about four months from September 2008 to January 2009. See a four-year weekly chart of the Gold ETF GLD below.


The bearish behavior of gold in latter 2008 was caused by the Credit Crisis. While you have probably heard ad nauseum that gold is a safe haven in a crisis, this does not include credit crises
(which are crises in the financial system when the banking system has difficulty functioning). We just saw that gold went down during the 2008 credit crisis and yet many gold "experts" somehow can't figure out that it should go down during the current 2011 credit crisis coming out of Europe. In our era, gold can drop during a credit crisis because central banks lease gold at low rates to the big banks and hedge funds. These entities are desperate to raise cash, so they sell the gold into the market (they can't sell many of the assets on their books). This depresses the price of gold -- temporarily. But at some point, they have to buy the gold back and return it to the central bank it was leased from. This makes the price of gold rise again. I explained the entire process in the second volume of my book "Inflation Investing", which covers gold, silver and other metals.

Gold has support at the 65-week simple moving average, but this is not the likely bottom in a full-blown credit crisis.  In order to find that, it is necessary to look at a monthly chart. It can be seen from this that the ultimate support would be at the 40-month simple moving average. Currently, this is around 120 for the gold ETF GLD. This possible buy point, which should be considered a worst-case scenario, was discussed in the October meeting of the New York Investing meetup. See the five-year monthly chart for GLD below.


It's important for investors to focus on the big picture and not get carried away with all the distractions of day to day price movements. Markets go up and down. No market goes in one direction. Every time gold drops, commentators come out of the woodwork saying it means the rally is over and deflation is taking place -- neither is true. It is the bigger price movements that have meaning and gold is in a long-term uptrend. In any secular bull market, a large drop is always a golden opportunity to buy. Just wait until there is some evidence that a bottom has been put in.  

Disclosure: None

Daryl Montgomery
Author: "Inflation Investing - A Guide for the 2010s"
Organizer, New York
Investing meetup http://investing.meetup.com/21

This posting is editorial opinion. There is no intention to endorse the purchase or sale of any security.

Wednesday, December 14, 2011

Gold and Silver Plummet as Dollar Rallies on EU Woes


The 'Helicopter Economics Investing Guide' is meant to help educate people on how to make profitable investing choices in the current economic environment. We have coined this term to describe the current monetary and fiscal policies of the U.S. government, which involve unprecedented money printing. This is the official blog of the New York Investing meetup.

The euro fell to a yearly low on December 14th as Italian interest rates at auction hit new highs. Collateral damage to the EU crisis is showing up not only in stock prices, but in the precious metals markets as well. 

The euro fell below the psychologically important 1.30 level in European trade and is testing support from last January. If it breaks that support (and it is pretty certain that it will), the 125 level is the next stop and 1.20 after that. The euro can be tracked through the ETF FXE. At the same time the euro is breaking down, the trade-weighted dollar has broken out. The dollar has been stuck at key resistance at 80 since September. It tested  this level both in September and in November. It traded as high as 80.67 in early morning trade. There is still strong resistance just under 82. A break above that will cause the dollar will head toward 88. The dollar can be tracked through the ETF DXY.

As the dollar rises, gold and other commodities fall. Spot gold was as low as $1562 an ounce in early New York trade. Gold plummeted after the New York open and was down as much as $68 an ounce.
Gold can be tracked through the ETF GLD. Gold decisively broke its 200-day moving average (which is very bearish) and this was the first time it has traded below this level since early 2009. The next level of support is the 65-week moving average, which is currently in the high 1400s.

While gold in general should go up during a crisis, this did not happen in the fall of 2008 -- gold was down around 30% at the time. During credit crises -- and the situation in Europe is a second global credit crisis -- it is reasonable for gold to decline. Central banks lease gold cheaply to banks and large hedge funds and they sell it on the market to raise quick cash (I have explained how this is done is some detail in my book "Inflation Investing"). This time around, there is the added danger that the IMF will sell some of its large hoard of gold to raise money for a eurozone bailout.

Gold's companion metal silver is much more volatile than the yellow metal and is influenced by the economy as well as financial market events. Silver traded as low as $28.47down $2.37 after New York trading opened. This was more than a 7% drop. Silver can be tracked through the ETF SLV. It has strong support around $26. If it breaks that, expect it to head toward the $21 level.

The EU debt crisis is not over and is likely to continue for a while longer and possibly for many more months. EU leaders have come up with one "solution" to the crisis after that has failed shortly after it was announced. Look to the markets to see whether or not their future gambits will create some viable end to their problems. So far the markets have made it very clear that the situation in Europe is continuing to deteriorate and it is dangerous to be on the long side of almost any investment except the U.S. dollar. 

Disclosure: None

Daryl Montgomery
Author: "Inflation Investing - A Guide for the 2010s"
Organizer, New York Investing meetup
http://investing.meetup.com/21

This posting is editorial opinion. There is no intention to endorse the purchase or sale of any security.

Monday, October 3, 2011

A Terrible Third Quarter Will Be Followed by a Bad Fourth


The 'Helicopter Economics Investing Guide' is meant to help educate people on how to make profitable investing choices in the current economic environment. We have coined this term to describe the current monetary and fiscal policies of the U.S. government, which involve unprecedented money printing. This is the official blog of the New York Investing meetup.

The third quarter of 2011 had the biggest drop and most volatility for stocks since 2008.  The fourth quarter may not be much better since the cause of the problem is a new credit crisis and an emerging global recession. Both will continue to be a drag on the market.

Except for small cap stocks, the U.S. markets did somewhat better than many overseas markets during the quarter. The Hang Seng in Hong Kong was down 25.7%, the CAC-40 in France fell 25.6% and the DAX in Germany dropped 25.0%. Only the Russell 2000 in the U.S. was lower by a comparable amount, falling 24.1% from its May 31st close. These indices are all in deep bear territory. Not much better was the Bovespa in Brazil. It lost 19.0% in the third quarter. The Brazilian market peaked in November 2010 and it too is in a bear market.

While the bigger cap U.S. indices weren't down as much, they were severely damaged nevertheless. The S&P 500 was lower by 15.9%, the Nasdaq by 14.8% and the Dow industrials by 13.2%. This was just the drop during the quarter. U.S. stocks in general peaked on May 2nd. From its high back then to its low in the third quarter, the S&P 500 dropped 19.6%. A bear market is defined as a loss of 20%.

Volatility returned to the markets with a vengeance in the third quarter. The VIX index reached a high of 48.00, not much below its peak in the 2000 to 2002 mega-bear, but well off its Credit Crisis peak around 90. Mini-crashes returned to the market, with both the Nasdaq and Russell 2000 experiencing drops equal to or greater than 5% on three different days.  There were four consecutive days in August when the Dow was up or down by 400 points or more. A volatile market is prone to selling and  markets usually need to calm down before they can bottom.

Just as was the case during the Credit Crisis year of 2008, only two major assets were up in the third quarter — treasuries and gold. The 10-year hit an all-time low yield of 1.71% (bond prices go up when yields fall). This was well below the previous low that took place because of the Great Depression in the 1930s. While the price of gold fell by 15% at the end of the quarter, it rallied from the beginning until its peak on September 6th. It wound up rising 5.8% (as measured by GLD) from its closing price on May 31st. Its companion precious metal, silver, had a quarterly drop of 23.1%.

There is no reason to think that the market will bottom until problems in Europe come to some stable resolution. Greece admitted over the weekend that it would not be meeting the budget targets that were part of the terms of the first bailout. Global markets are once again selling off, as if this was somehow surprising news — Greece has misrepresented its financial number repeatedly, it would only be surprising if they turned out to be accurate. Greece may still get its next tranche of bailout money, since the EU has shown over and over again that its standards for the currency union are meaningless. Eventually though Greece will default because too much bailout money will be needed to keep it afloat. Even at that point, Spain and Italy will have to be reckoned with.
The other issue facing the markets is a global economic downturn. While a case can be made that the post-Credit Crisis economy never got out of recession (the unemployment rate and consumer confidence remained at recession levels for instance), the important question is whether or not economic activity is declining now. Last week, even the ECRI (Economic Cycle Research Institute) admitted the U.S. economy was heading down. Since a credit crisis can make an economic decline much worse, this doesn't bode well for the markets in the upcoming months.
Disclosure: None 

Daryl Montgomery
Author: "Inflation Investing - A Guide for the 2010s"
Organizer, New York Investing meetup
http://investing.meetup.com/21

This posting is editorial opinion. There is no intention to endorse the purchase or sale of any security.

Monday, September 26, 2011

Gold and Silver Recover After Big Drop in Asia

 
The 'Helicopter Economics Investing Guide' is meant to help educate people on how to make profitable investing choices in the current economic environment. We have coined this term to describe the current monetary and fiscal policies of the U.S. government, which involve unprecedented money printing. This is the official blog of the New York Investing meetup.

While Americans slept, gold and silver prices plummeted in Asia. The low took place in Hong Kong  at approximately 3AM New York time when spot gold flirted with the $1540 level and silver was around $26. A strong rally then took place after the London market opened half an hour later.

By the time Monday New York trading began at 8AM, spot gold was selling for $1626 and spot silver at $28.50 an ounce. So the average American investor wasn't able to buy into the carnage. The low prices set in Asia will almost certainly be tested in the future however and there is a good chance that  will take place during U.S. trading hours. As of now though, the $30 support level for silver is history.

In the last three days, gold has experienced it biggest drop since the 2008 Credit Crisis. Silver has had it largest decline on record. There is significant technical damage, especially for silver. On the 24-hour charts, silver has decisively broken its 325-day/65-week simple moving average -- a key line in the sand separating bullish and bearish trading behavior. This level is in the low 1400s for gold. Silver's behavior is telegraphing that gold will almost certainly hit that level. If silver can't hold the 26 level in the future, the next stop for it will be in the 21/22 range.

What is causing the big drop in precious metals? Well, both silver and gold were extremely overbought at their highs. When this happens, a lot of traders were buying heavily on margin. This creates a situation where many of them will be forced to sell at the same time if any bad news takes place. Once the selling starts, the market cascades downward. We are seeing that with gold and silver right now. Such behavior is common in any strong rally and does not by itself indicate a bubble (that would require at least a 500% to 1000% yearly price rise for the precious metals).

While a rising U.S. dollar during September and new margin requirements from the CME last Friday have led to precious metals selling, the big problem is in Europe. The Greek debt and EU bank crisis is causing a liquidity crunch for the big trading houses and they are selling whatever they can to raise cash.  The inadvertent result is that investors are being given the opportunity to pick up precious metals at bargain prices. A little patience might be advisable before hitting the buy button however.


Disclosure: None


Daryl Montgomery
Author: "Inflation Investing - A Guide for the 2010s"
Organizer, New York Investing meetup
http://investing.meetup.com/21

This posting is editorial opinion. There is no intention to endorse the purchase or sale of any security.

Friday, September 23, 2011

Silver Crashes; Gold Breaks Key Support


The 'Helicopter Economics Investing Guide' is meant to help educate people on how to make profitable investing choices in the current economic environment. We have coined this term to describe the current monetary and fiscal policies of the U.S. government, which involve unprecedented money printing. This is the official blog of the New York Investing meetup.

The silver market had a major crash on Friday -- there is simply no other way to put it. Spot prices were down as much as 17.1% or $6.18 an ounce. Gold was damaged as well, but not nearly as much. At its worst, it was down 6.3% or $108.60 an ounce. Both gold and silver traded below previous lows set earlier this year.

The drop in silver was truly spectacular. It was down by double digit amounts on Thursday and then by an even  greater amount today. The main silver ETF, SLV, has two huge gaps on its chart. The spot price low of $29.76 reached an area of major support. There is chart support, moving average support and a Fibonacci retracement at that level. A tradable bounce should take place soon and the gap in the chart from today is likely to be covered in that move. Those with a longer-term investing horizon might want to wait before buying. The next level to keep an eye on is around $26 where there is chart support and another Fibonacci retracement.

The silver selloff is much more advanced than is the one for gold. Silver peaked in April and had its first big selloff in May. It made a double bottom in May and July and didn't trade below those levels until today. Gold on the other hand made a double top in mid-August and early September. It confirmed that double top today by trading below its August low. Spot gold fell to $1628.60 an ounce at its worst point, breaking its support in the lower 1700s by quite a bit.

The precious metals charts are showing technical damage, with silver in much worse shape than gold. Gold broke its 50-day simple moving average yesterday for the first time since June. Today, silver pierced its 325-day simple moving average -- an important support level for any commodity. The DMI technical indicator gave a sell signal for SLV on the daily charts today and was about to do so for the major gold ETF, GLD. In the short term, both are very oversold however.

The huge price drops in silver and gold can only be explained by substantial hedge fund selling that smacks of credit crisis panic. Both of these markets have risen on highly leveraged buying. Once a few overextended funds are forced to sell because of the financial turmoil in Europe, things can go downhill pretty fast. Stops get taken out and this causes more selling, which in turn takes out more stops and leads to more selling. After this, a rally will follow and there should be a test of the low. If it holds, then a sustainable rally can take place. We are not nearly at the point yet. 

Disclosure: None

Daryl Montgomery
Author: "Inflation Investing - A Guide for the 2010s"
Organizer, New York Investing meetup
http://investing.meetup.com/21

This posting is editorial opinion. There is no intention to endorse the purchase or sale of any security.

Thursday, September 22, 2011

Stocks and Commodities Setting Up for a Major Breakdown

 
The 'Helicopter Economics Investing Guide' is meant to help educate people on how to make profitable investing choices in the current economic environment. We have coined this term to describe the current monetary and fiscal policies of the U.S. government, which involve unprecedented money printing. This is the official blog of the New York Investing meetup.

Global markets were acting like they were on the verge of a collapse on Thursday, the day after the Federal Reserve's Operation Twist announcement. The selling was ugly and is likely to get even worse in October.

In Asian trading last night, the Hang Seng in Hong Kong barely avoided a mini-crash, falling 4.9% (5.0% is the cutoff) or 912 points. The Sensex in India shed 704 points and was down approximately 4.0%. The market is attempting to cover a gap on the charts made two years ago. The chronically- bearish Nikkei in Japan was down only 2.1%.

In Europe, both the FTSE in the UK and the DAX in Germany also almost closed in mini-crash territory. The FTSE was down more than 5.0% at one point, but managed to rally toward the end of day. The DAX closed down 4.96%, just a whisker less than a mini-crash. The CAC-40 in Paris wasn't as fortunate. It closed down 5.3%. European banks were in the forefront of the selling with French banks being particularly hard hit. French banks are heavily exposed to Greek government and corporate debt. UK banks were also down considerably because of problems left over from the 2008 Credit Crisis.

The U.S. markets opened down and got worse as the trading day proceeded.  The Dow closed down 391 points or 3.5%, the S&P 500 39 points of 3.3%, the Nasdaq 83 points or 3.3%, and the small cap Russell 2000 21 points or 3.2%. Banks stocks in the U.S. received bad news with Moody's downgrading the credit ratings of Bank of America, Wells Fargo and Citigroup. Moody's indicated that it believes bailouts will be less likely in the future.

Commodities were not immune to the selling with gold, silver, oil and copper experiencing significant downside action. Spot gold traded as low as $1722.30 in New York. December futures were down as much as $78.50 at one point. Spot silver traded as low as $35.41. Both gold and silver had some recovery from their lows. Crude Oil (West Texas Intermediate) fell to $80.89 and was down $5.03. Economically-sensitive copper was crushed falling as low as $3.46 a pound. It was down 8.6%. Copper has fallen more than 20% from its all-time high in February and is technically in a bear market. The price behavior of copper is supposedly the best indication of global economic activity.

The key levels for investors to watch are the August lows for stocks and commodities. These were tested today on the Dow Industrials and the Russell 2000. If these get taken out, things should really start to get interesting.  These levels have already been broken in France and the major emerging markets. Technical analysts should note that the Dow Industrials, the S&P 500 and the Russell 2000 all formed  a very clear head and shoulders topping pattern in August and September.

Disclosure: None

Daryl Montgomery
Author: "Inflation Investing - A Guide for the 2010s"
Organizer, New York Investing meetup
http://investing.meetup.com/21

This posting is editorial opinion. There is no intention to endorse the purchase or sale of any security.

Thursday, September 1, 2011

Should Stocks be Rallying on Hopes of QE3?


The 'Helicopter Economics Investing Guide' is meant to help educate people on how to make profitable investing choices in the current economic environment. We have coined this term to describe the current monetary and fiscal policies of the U.S. government, which involve unprecedented money printing. This is the official blog of the New York Investing meetup.  


Stocks have rallied significantly since August 10th on the hopes that the Federal Reserve will engage in a third round of quantitative easing (QE) -- a form of money printing. While QE1 and QE2 were successful in juicing stock prices, this is not what the Fed is supposed to be doing.

The Fed's current mandate was established by the U.S. Congress in 1977 in the Federal Reserve Reform Act. This legislation requires the Fed to establish a monetary policy that "promotes maximum employment, stable prices and moderate long-term interest rates". Manipulating stock prices is not supposed to be on the Fed's agenda. Quantitative Easing was unknown in 1977 and was therefore not specifically addressed by Congress.


If anything,the Fed has significantly overshot in its goal to keep long-term rates moderate. The Fed Funds rate has been kept at around zero percent since December 2008. The Fed has stated it will maintain this rate until 2013. The interest rate on the 10-year treasury fell below 2.00% at one point this August -- a record low. Two-year rates fell below 0.20%, also record lows and well below the bottom rate during the Credit Crisis. Low interest rates indicate an economy in recession and not deflation as is commonly claimed in the mainstream press. Maintaining interest rates at a low level for too long is inflationary however.


The Fed announced its first quantitative easing program in November 2008 (according to an analysis of its balance sheet, it was begun somewhat earlier). The second round ended this June. How has the employment situation changed during the two rounds of QE?  When QE1 started in November 2008, the official U.S. unemployment rate was 6.8%. When it ended in June 2011, it was 9.2%. The high was 10.1% in October 2009. The post-World War II average has been 5.7% and unemployment has fallen to the 3% range when the economy is strong. With respect to employment, quantitative easing seems to have been a failure.

So what about price stability, the Fed's other mandate? While the inflationary effects of quantitative easing are most evident in commodity prices, the typical American consumer has seen them in gasoline, food and clothing prices. The average price of gasoline was as low as $1.60 a gallon when the Fed started QE1 and it almost reached $4.00 a gallon during QE2. A number of commodities, including cotton and copper, hit all-time record-high prices during QE2. Gold, the ultimate measure of inflation,rose to one new price high after another. Silver went from under $10 an ounce to over $48 an ounce. Quantitative easing obviously hasn't led to price stability. In fact, it has resulted in much higher prices and is therefore counterproductive to the Fed's goal of limiting inflation.

There is no question that quantitative easing has helped the stock market and resulted in higher stock prices. This is not exactly a secret however and all Wall Street traders are well aware of it. They will therefore push stock prices higher if they think more quantitative easing is on the way and much of any rally that results will occur before it even takes place. Quantitative easing is also no panacea for stock prices. It doesn't insulate the market from external shocks. While it doesn't make crashes more likely, it will make them worse when they occur. A default on Greek, Spanish or Italian debt and any number of other crises will have greater impact than they would have ordinarily because the market has been pumped up to artificially high levels. The market has also become dependent on quantitative easing and has not been able to rally since late 2008 without it. Almost as soon as it stops, the market drops and those drops will become more serious after each succeeding round.

Disclosure: None

Daryl Montgomery
Author: "Inflation Investing - A Guide for the 2010s"
Organizer, New York Investing meetup
http://investing.meetup.com/21

This posting is editorial opinion. There is no intention to endorse the purchase or sale of any security.

Tuesday, August 30, 2011

A Twisted Tale of Gold Stolen Almost 80 Years Ago


The 'Helicopter Economics Investing Guide' is meant to help educate people on how to make profitable investing choices in the current economic environment. We have coined this term to describe the current monetary and fiscal policies of the U.S. government, which involve unprecedented money printing. This is the official blog of the New York Investing meetup.

Apparently the government can keep property stolen from you, but you can't keep property stolen from the government. A recent Bloomberg Businessweek article entitled "Gold Coins: The Mystery of the Double Eagle" details how the Secret Service has spent almost 80 years trying to track down 1933 Double Eagle $20 gold coins missing from the Philadelphia Mint.  It is well-known however who stole millions of dollars of gold from the American public in the same year - and since it was the U.S. government, lot's of luck in getting compensation.

The 1933 Double Eagle never went into circulation. All coins were ordered to be melted down because U.S. citizens were banned from owning gold in the same year. Moreover, the Roosevelt Administration confiscated all gold and paid gold holders $20.67 per ounce. Those who failed to turn their gold in were subject to a 10 year jail sentence - more time than some violent criminals got - and a $10,000 fine. Once the government had the citizenry's gold, it raised the price to $35.00 an ounce or 41% higher. The price difference represents the value of personal property stolen by the government.

Sensibly, some people sued the federal government claiming the gold seizure was unconstitutional. After all, the U.S. Constitution clearly protects property rights of Americans - if it is enforced that is. Moreover, the Roosevelt Administration claimed it was given authority to seize everyone's gold through a World War I law that gave the government sweeping powers to seize personal property to protect the Republic during wartime. There was of course, no war in 1933.

Nevertheless, the Supreme Court, in one of its most absurd rulings of all time, ruled the gold seizure perfectly legal. Even today, the mainstream press continues to soft peddle this trashing of the U.S. Constitution. The Bloomberg Businessweek article states that Roosevelt's Executive Order 6102,  "prohibited the hoarding of gold", rather than the owning of gold. While the gold was taken long ago, the same propaganda from the 1930s seems to still be with us.  

Apparently also in 1933 at least one employee at the Philadelphia Mint smuggled out some Double Gold Eagles. The government was unaware of this however. Around 1937, a Philadelphia coin dealer offered some Double Gold Eagles for sale. One of them, after being purchased by another coin dealer, was sold to King Farouk of Egypt. Unbeknownst to the Secret Service, the Secretary of the Treasury's office issued an export license for this coin on Feb. 29, 1944.

This was only one of many things that took place at Treasury that the Secret Service knew nothing about. Not stated in the Bloomberg Businessweek article was that the Under-Secretary of the Treasury at the time, Harry Dexter White, was the most highly placed Soviet agent in the U.S. government. This inconvenient, but well-documented truth has been covered up or minimized by left-wing historians and reporters for decades. White began working for the Roosevelt Administration in 1934 and concentrated on the relationship of gold and silver to currency management. The U.S. federal government confiscated American's private silver holdings in 1934.

The Secret Service arranged an elaborate sting operation in 1996 to eventually get the Farouk gold coin back. Thank goodness they didn't waste their time investigating Bernie Madoff while he was in the process of ripping off the public in his record breaking $65 billion Ponzi scheme. Eventually, after being seized from a British subject who had bought it, this coin was sold at auction and the proceeds were split between him and the U.S. government. Recently more coins have surfaced in the United States and the government has simply confiscated them -- something it is very good at doing when it comes to gold.

That the U.S. government claims rights through perpetuity and across national borders for its property, but unconstitutionally denies them to its own citizens is the major issue in the Bloomberg Businessweek article (one they seem to have missed entirely), but not the only one. Other than the dangerous precedent of property rights for the average person being trashed, the article brings up the point that the federal government is unaware that gold is stolen from its storehouses and the government wastes its time on pursuing trivial matters on its behalf while ignoring major economic crimes involving billions or even trillions of dollars. Fort Knox hasn't been audited  since 1954. How much of the gold is still there?  What other major Ponzi schemes and frauds are taking place while government agents spend their time tracking down gold coins from 1933?

Disclosure: Do not own any 1933 gold coins.

Daryl Montgomery
Organizer, New York Investing meetup
http://investing.meetup.com/21

This posting is editorial opinion. Like all other postings for this blog, there is no intention to endorse the purchase or sale of any security.

Friday, August 19, 2011

Three Crashes and a Second Credit Crisis


The 'Helicopter Economics Investing Guide' is meant to help educate people on how to make profitable investing choices in the current economic environment. We have coined this term to describe the current monetary and fiscal policies of the U.S. government, which involve unprecedented money printing. This is the official blog of the New York Investing meetup.

The tech heavy Nasdaq and small cap Russell 2000 crashed again yesterday, August 18th. Nasdaq was down 131 points or 5.22% and the Russell 2000 was down 42 points or 5.90%. This is the third crash for both of them since the beginning of the month. Repeating crashes (drops of 5% or more in one day) were  common during the Credit Crisis in the fall of 2008 and indicate severe stress in the global financial system.

As in the fall of 2008, bank stocks are leading the way down. The only difference now is that bank stocks in Europe are getting hit the hardest, whereas it was U.S. and UK banks three years ago. So far, U.S. markets are holding up better than those in the EU. The Dow and S&P 500 have had only one mini-crash so far. The German DAX has had several. While continental European markets have been hit the hardest, Asian markets have continued to suffer the least from the current turmoil. The Hong Kong markets are being more impacted than those in Japan.

While U.S. banks Morgan Stanley and Wells Fargo were down somewhat more than 4.5% yesterday and Bank of America and Citigroup 6.0%.  This was much better than the 10% drop in Germany's Commerzbank, the 11.5% drop in the Britain's Barclays and the 12% drop in France's 
Société Générale. As of August 18th, the EURO STOXX Financials index was down 38% from earlier this year.
Just last week, French banks were supposedly in trouble, but this was denied by them and one major French news outlet retracted a story that claimed this was the case. Yesterday, the ECB (European Central Bank) said one bank, which it didn't identify, had paid above-market rates to borrow $500 million a day for seven days. Today, it was reported that the U.S. Fed supplied $200 million of liquidity to the Swiss National Bank in the form of forex swaps. These are two separate issues. Switzerland is suffering from a skyrocketing currency (which is going to cause massive loan defaults in Eastern Europe if it continues since many loans there are denominated in Swiss francs), whereas the ECB is trying to keep banks afloat despite the fallout from the Greek debt crisis.

The chances of a full Greek default  (a selective default with bondholders taking a 21% haircut was already part of the second bailout deal reached in July) intensified on Thursday. Finland insisted that Greece provide a cash deposit equivalent to its share of the second bailout guarantees. Four other countries then made similar demands. This of course undermines the bailout by taking away money with one hand that the bailout is providing with the other.

Financial crisis behavior was also evident in the U.S. treasury markets. The yield on the 10-year fell as low as 1.9872 on Thursday, taking out the low from 2008. The two-year treasury has been hitting a series of new lows and has been significantly below its Credit Crisis bottom for some time now. One thing that is different from the 2008 Credit Crisis is that gold is rallying strongly and is in a blowoff. The December gold futures contract hit another all-time high  at $1881.40 this morning before U.S. stocks opened.  Gold has always been a safe haven throughout history and despite claims to the contrary, it will remain so.
Disclosure: None
Daryl Montgomery
Organizer, New York Investing meetup
http://investing.meetup.com/21 
This posting is editorial opinion. Like all other postings for this blog, there is no intention to endorse the purchase or sale of any security.

Tuesday, June 7, 2011

Ben Bernanke's 'It's Not My Fault' Inflation Speech

The 'Helicopter Economics Investing Guide' is meant to help educate people on how to make profitable investing choices in the current economic environment. We have coined this term to describe the current monetary and fiscal policies of the U.S. government, which involve unprecedented money printing. This is the official blog of the New York Investing meetup.


Americans shouldn’t expect to hear the truth about inflation from Fed Chief Ben Bernanke and he didn't disappoint in a speech he gave to the International Monetary Conference in Atlanta, Georgia on Monday. The money-printer-in-chief of the Federal Reserve denied that the Fed’s easy money policies are responsible for the inflation that is currently showing up in commodity prices. The public shouldn’t have expected anything else from the dissembling Fed Chair, nor should they believe anything he says.

Bernanke claims that rapidly rising commodity prices are the result of rising demand and not enough supply. While in isolation this is always the case in economics, it doesn’t explain why demand is rising in leaps and bounds and why this has occurred at the same time the Fed has been on a money printing binge. Bernanke did not make comparisons in his speech between demand and prices in 2008, when the Fed turned up the printing presses to max and conditions right now. Let’s look at a few of them:  U.S. gasoline prices went from approximately $1.60 a gallon to almost $4.00. Oil prices have tripled from a low around $33 a barrel. Copper prices almost tripled during the same period. Cotton prices have gone through the roof and took out a high established around 150 years ago. Silver prices went from a low of $8.88 to almost $50.  And that’s just the beginning.
Did global demand for oil, copper, and silver increase by three or more times in two and a half years?  It most certainly did not. If anything economic demand has only increased by a few percent at most. There is something that did increase by a lot more however – the Fed’s balance sheet, which grows when it prints money. That has gone through the roof just like commodity prices. Money printing of course increases demand for any number of items because it makes a lot more funds available in the financial system. For some reason, Bernanke didn’t quite connect the dots between the two in his speech.
The recognition that increasing the available money in the economy leads to rising prices has been known for 500 years and was first proposed by well-known astronomer Copernicus. The idea is based on grade-school arithmetic. If you have an economy of a certain size and a given amount of money and you increase that amount of money, then each unit of money is worth less. It’s not rocket science, and yet Fed officials with PhDs from top schools can’t seem to be able to grasp this simple concept. Or perhaps they don’t want to do so.
Bernanke’s speech also didn’t explain why the price of gold has doubled since its Credit Crisis low. While gold does have some industrial uses, its price is a good gage of inflation expectations on the part of the investing public. Bernanke claimed these were under control, so we don’t have to worry about inflation. Gold is telling a very different story – and gold is not known to lie.
Bernanke also fell back on the 'employment is high and there is slack in the economy, so inflation can’t happen' argument. Historical analysis indicates that hyperinflation takes place under just such conditions. The most recent example happened in Zimbabwe in the 2000s (perhaps Ben didn’t read the papers during those years). As the economy collapsed and unemployment headed toward close to 100%, prices skyrocketed. It wasn’t the first time something like this has happened, it’s the same story over and over and over again throughout history – yet Ben keeps telling us it can’t happen. Well, I guess if you don’t let little things like reality intrude in your worldview, it can’t.
As an author of a book which includes a lot of material on inflation history, I found no case in the past where the authorities admitted their guilt in causing inflation. In every instance, the government printed a lot money or cut the coinage (if it was before paper money existed). Without exception in modern times, speculators and foreign influences are blamed for inflation. For some reason the government money-printers behind the inflation that ruins their countries just never seem to admit that they’re at fault. Bernanke’s recent speech is just another example of history repeating itself.   

Disclosure: None

Daryl Montgomery
Organizer, New York Investing meetup
http://investing.meetup.com/21
Author, "Inflation Investing: A Guide for the 2010s"

This posting is editorial opinion. Like all other postings for this blog, there is no intention to endorse the purchase or sale of any security.

Wednesday, June 1, 2011

Will You Become an Inflation Victim? Take this Simple Quiz


The 'Helicopter Economics Investing Guide' is meant to help educate the public on how to make profitable investing choices in the current economic environment. We have coined this term to describe the current monetary and fiscal policies of the U.S. government, which involve unprecedented money printing. This is the offical blog of the New York Investing meetup.


Recently, San Francisco Fed President John Williams assured the public that there won’t be runaway inflation in the United States. His remarks follow a long litany of comments from  Federal Reserve officials that inflation is under control, inflation is low, and other variations of there simply is no inflation.  People who know inflation history, and this includes very few people alive today, are getting little comfort from these remarks. Central bank officials have repeatedly assured the public that there is no inflation in the past despite inflation obviously existing. One of the most vocal and sustained denials took place in Weimar, Germany in the 1920s. The central bank, the treasury department and top economists all agreed that inflation wasn’t a problem. It eventually reached 100 trillion percent.

Americans just have to open their eyes to see that inflation exists. Gasoline prices have risen from a $1.60 a gallon at the bottom of the Credit Crisis to almost $4.00 today. A number of food commodities, including sugar and coffee are having sustained price rises, and food prices in the supermarket are noticeably higher. I have a friend who records all of his family’s food purchases in Quicken and even though they are eating the same foods in the same quantity, the amount they are spending has gone up 10% in the last year.  Prices of clothing are also rising because commodity cotton prices broke a 150-year high recently. Copper, which has the widest of uses of all metals, has also hit an all-time high earlier this year.

Yet, the Fed tells the public not to worry as it continues one program of money printing after another. Even though this has always resulted in inflation in the past (the basic laws of arithmetic would have to be violated if it didn’t), they claim things are different this time. The continually fall back on the argument that there is a lot of slack in the economy and since U.S. unemployment is around 9%, wages can’t rise and this prevents inflation. Unfortunately, real world observations of past major inflations indicate how absurd this line of reasoning is. Unemployment in Weimar, Germany rose to 23% as their inflation rate reached the trillion percent level. Slack in the German economy was nothing however compared to Zimbabwe in the early 2000s. Unemployment there reached 94% and literally nobody in the entire country had a job. The inflation rate in Zimbabwe is estimated to have been at the sextillion percent level (a number so huge it might as well be infinity).

Before inflation really gets out of control, take the  following quiz to find out how well-informed you are about inflation investments and how your portfolio will be affected by it.


QUIZ

ANSWER TRUE OR FALSE

  1. Safe investments like money market accounts, CDs and government bonds are just as good during high inflation as other times.
  2. TIPS (Treasury Inflation Protected Securities) will at the very least maintain my capital during inflation.
  3. Buy and hold in the stock market is an effective wealth building strategy during high inflation.
  4. The higher the inflation rate, the better residential real estate is as an inflation hedge.
  5. The U.S. dollar is the strongest currency in the world and will remain so during a period of high inflation.
  6. If I have 5% of my portfolio in gold, my assets are protected from high inflation.
  7. Of all possible inflation hedges, gold will provide the biggest return during high inflation.
  8. When inflation is taking off, commodity prices will rise at the same rate as inflation.
  9. When a government imposes wage and price controls, you can assume the inflation rate will come down and stay down.  
  10.  Speculators are the cause of high prices during inflation.


WHICH INVESTMENT WOULD YOU RATHER OWN DURING HIGH INFLATION?

  1. The U.S. dollar or the Australian dollar
  2. A U.S. treasury bond or a collectible Pez dispenser.
  3. A house in the Chicago suburbs or a 100-acre farm in Iowa
  4. A 5-year CD or a copper mining stock
  5.  Utility stocks or commodity oil
  6. Municipal bonds or Thai grade B rice
  7. TIPS or a set of silverware
  8. Long positions in U.S. treasuries or short positions in U.S. treasuries
  9. A money market account or a gold ETF (exchange traded fund)
  10. British stocks or an antique map of England


HOW TO GRADE YOUR QUIZ

The answers to questions 1 through 10 are all false. The correct answers for questions 11 through 20 are the second choice. If you scored between 0 and 5, don’t be critical the next time you see a homeless person looking for food in a public garbage can. If you scored between 6 and 10, you will probably remain in your home, but won’t be able to heat it that much and your cupboards won’t be well stocked. If you scored between 11 and 15, you will get through a period of high inflation relatively unscathed. If you scored between 16 and 20, go to a neighborhood of high-priced homes (assuming you don’t already live in one), find someone who scored under 5 on the quiz and tell him that you will be living in his house in the future.

Explanations for questions 1 through 10: People who own liquid investment, such as money market accounts, CDs and bonds will lose money during inflation. In the worst cases, they will lose everything. TIPS are not an effective protection because their returns are based on official inflation rates and the U.S. government has been underreporting inflation since 1983. Stock prices tend to go sideways during inflationary periods and can be highly volatile. Residential real estate is a very poor investment during inflation because it can become extremely cash flow negative because of rising taxes and maintenance costs. The U.S. dollar has not been the strongest currency in decades and it went down against every major currency between 2000 and 2010. It is good to hold gold during high inflation, but 5% isn’t enough. Gold does not produce the highest inflationary returns, silver and many other investments can outperform it. It does produce the most reliable returns however. Commodity prices actually rise much faster than the overall inflation rate (examples were cited in the beginning of the article). Wage and price controls almost always fail. The only work if government money printing is permanently halted at the same time that they are imposed. Speculators don’t cause high prices, but along with foreigners, they are universally blamed for inflation. Central bank money printing is the cause of high prices.

Explanations for questions 11 through 20:  In general, tangible investments are preferred to liquid investments during inflation, so if the choice is between a money market account, CD, or bond versus a commodity or commodity related stock, the commodity is the best investment. Antiques and collectibles are also better investments that liquid investments. Of all the public currencies in the world, the Australian dollar most closely tracks price changes in gold, so it is the top choice during inflation. Farmland is the best real estate investment during inflation. Interest rates go up during inflation, so the way to make money in bonds is to short them, not own them.
Disclosure: Author does not own any specific investments cited in this article, but does hold some U.S dollars.


This posting is editorial opinion. Like all other postings for this blog, there is no intention to endorse the purchase or sale of any security
 

Wednesday, October 6, 2010

Quantitative Easing Means Foreigners Will Dump Treasuries

The 'Helicopter Economics Investing Guide' is meant to help educate people on how to make profitable investing choices in the current economic environment. We have coined this term to describe the current monetary and fiscal policies of the U.S. government, which involve unprecedented money printing. This is the official blog of the New York Investing meetup.


Stocks and gold rallied strongly yesterday on the news that Japan is doing more quantitative easing and remarks from Fed Chair Ben Bernanke that more quantitative easing (also known as money printing) would be good for the U.S. economy. The major, and possibly disastrous, downside risks were not mentioned in mainstream media reports.

Quantitative easing has been tried many times before in Japan. It has failed to produce any lasting results, which is why it needs to be done again. The Fed has already engaged in quantitative easing during the Credit Crisis (frequently referred to as QE1) and is also doing it again because it didn't have any lasting results. Moreover, it isn't clear that any positive results took place at all because of QE1. The Fed claims it was a great success, but hasn't offered any proof to support its contention. There is certainly proof that it didn't work. Exhibit one is the much higher unemployment rate that we currently have. Just the need to do quantitative easing again is in and of itself proof that this was a failed policy.

While the advantages of quantitative easing are dubious, the risks can be horrendous. The biggest danger is for a country with a massive debt held outside that country (this describes the United States, but not Japan) Printing money is inflationary. It devalues the currency of the country doing it. The trade-weighted dollar did indeed have a big sell off on the news. Inflation-sensitive gold hit another all-time high. Quantitative easing will encourage large foreign holders to sell U.S. debt and to not make purchases in the future, except for TIPS (treasury inflation protected securities). Even TIPS will ultimately be shunned because they reflect the understated official U.S. government inflation rate. Without this source of foreign capital, the U.S. cannot fund its budget deficit or its trade deficit. This would send the economy into a severe contraction. The only way to avoid that would be to print even more money...and then more money ....and then more money. Without the money printing, the U.S. economy would enter a severe depression. With money printing, the risk is hyperinflation.

The biggest foreign holders of U.S. treasuries are China, Japan, the UK, the Oil Exporters, Brazil, the Caribbean Banking Centers (off-shore money havens used to hide the parties involved in financial transactions), Hong Kong, Russia, Taiwan, Switzerland and Canada. Why would these countries continue holding U.S. government bonds if they know they are going to be paid back in devalued currency? Why will these countries want to buy more bonds in the future? According to TIC (Treasury International Capital) data, China held $939.9 billion in U.S. treasuries in July 2009. In July 2010, it held only $846.7 billion. It is also known that China has been selling long-dated paper and moving into the short end of the yield curve. Other countries would want to do the same in response to quantitative easing. This may be why yields on the two-year note keep hitting all-time lows.

The impact of the first round of U.S. quantitative easing shows up even more clearly in the amount of treasuries held by the Fed. At the end of the first quarter, the Fed held $5.259 trillion in U.S. government bonds - more than five times the amount of China, the largest foreign holder. The nightmare scenario of the U.S. having to print money to buy its own government bonds because it can no longer borrow enough money from foreign sources to fund its government operations has clearly already taken place. That the Fed is now doing more quantitative easing indicates a self reinforcing inflationary cycle is underway. Investors should act accordingly.

Disclosure: No positions.

Daryl Montgomery
Organizer, New York Investing meetup
http://investing.meetup.com/21

This posting is editorial opinion. There is no intention to endorse the purchase or sale of any security.